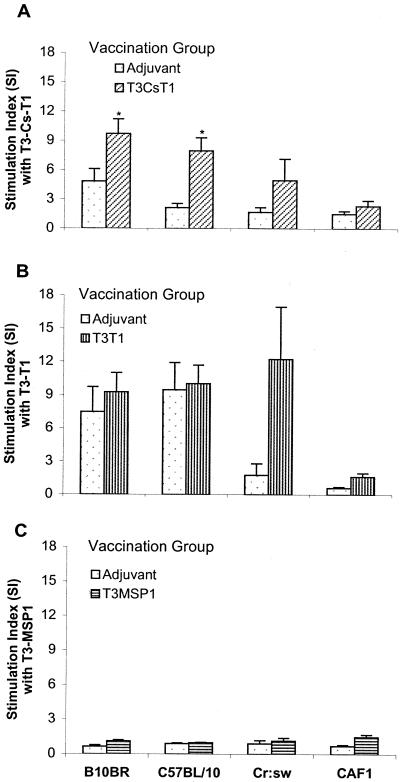
FIG. 4.
Analysis of T-cell proliferation induced by MAP constructs. Mice of different genetic backgrounds (six to eight per group) were immunized with the T3-CS-T1 (A), T3-T1 (B), or T3-MSP1 (C) MAP. Control groups of mice received adjuvant alone. At the end of the immunization protocol spleen cells were restimulated in vitro with the respective MAP at a concentration of 5 μg/ml. The results are shown as means ± standard errors of the means. ∗, significant difference (Student's t test; P < 0.05) compared to adjuvant control group.

