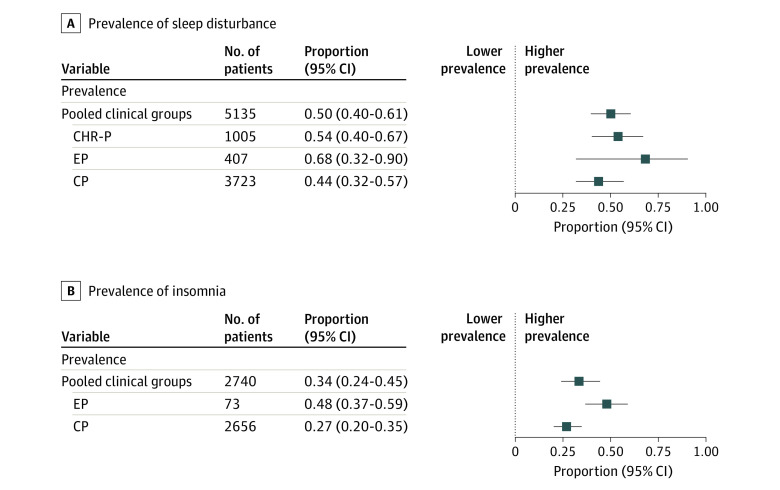
Figure 2. Forest Plots of Prevalence of Sleep Disturbance and Prevalence of Insomnia .
Logit transformation was applied for analysis and the final pooled logit was back transformed to proportions for ease of interpretation of the forest plots. CHR-P indicates clinical high risk for psychosis; CP, chronic psychosis; EP, early psychosis.

