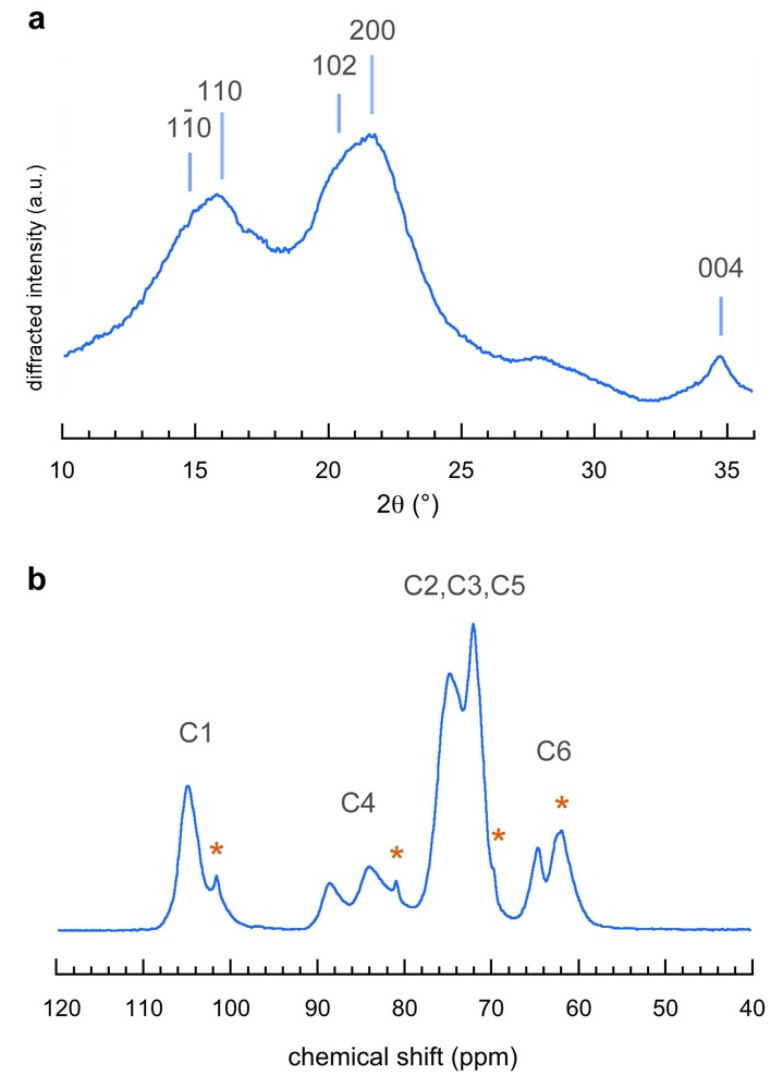
Figure 3.
(a) X-ray powder diffraction pattern, and (b) CP/MAS 13C-NMR spectrum of the extracted nanocellulose (ENC). In (a), the Miller indices correspond to those of cellulose Iβ [33]. In (b), the asterisks indicate the presence of a minor fraction of residual mannan I in the ENC sample (Figure S3). * means other significant peaks.

