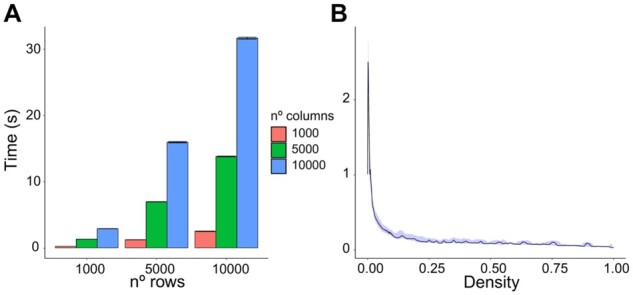
Fig. 3.

MutExMatSorting performances on binary matrices (BMs) of different sizes and densities. (A) Performance assessment when varying number of rows and columns in the BM. We kept the density (defined as the ratio between the number of non-zero entries over the total) equal to 0.1 across all instances. The error bar shows the 95% confidence interval obtained on 1000 iterations for every combination parameter. (B) Performance assessment when varying the density of non-zero entries in a BM of constant size (1000 × 1000). The blue shade is the 95% confidence interval obtained on 1000 iterations for every density instance we tested
