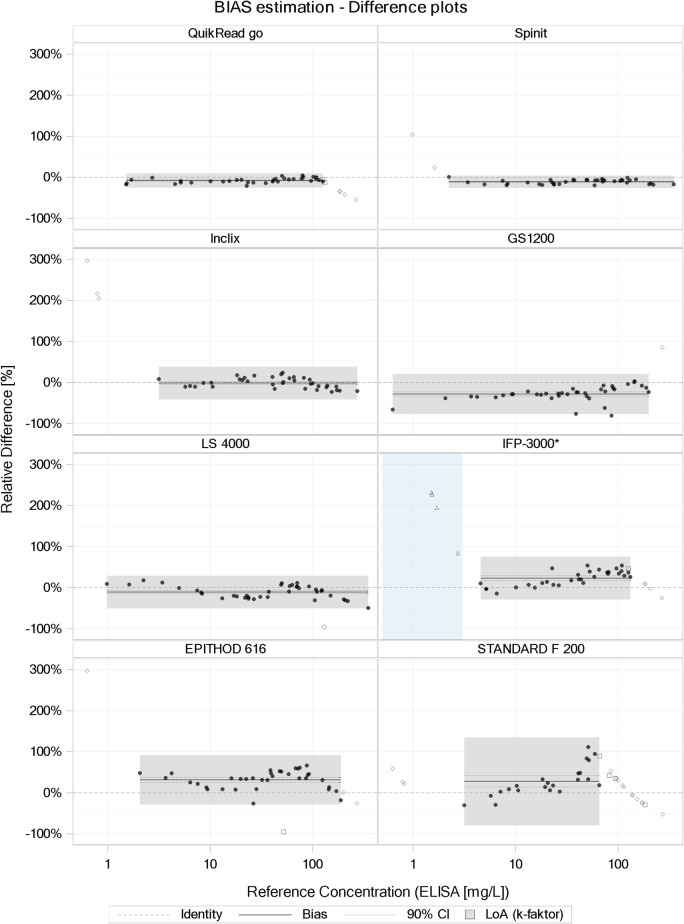
Fig 3. Bland–Altman plots for quantitative tests.
Bland–Altman plots comparing CRP POC test results measured using the various quantitative index tests and CRP results measured using the reference method (RM). The X-axes depict the CRP values of the RM, and the Y-axes depict the relative difference between CRP results measured by the POC test under study and the RM. The thick black lines represent the bias and the dotted line its 90% CI; the LoA are represented by the vertical expansion of the gray areas, their horizontal range covers the observed concentrations within AR of the respective index method*. Black dots represent samples included in the analysis, while the other symbols represent excluded data points (values out of AR and outliers). Note: For Standard F200 and IFP-3000, the assumption of concentration-independent relative bias, which is essential for the validity of the BA plot analysis, is questionable. *For IPF3000, three samples were excluded in the low concentration range (<3 mg/L) to achieve constant CV (variance homogeneity) in the analyzed range. As a consequence, the lower limit of the AR is approximately 4 mg/L and not 0.5 mg/L (denoted by the light-blue area in the figure).

