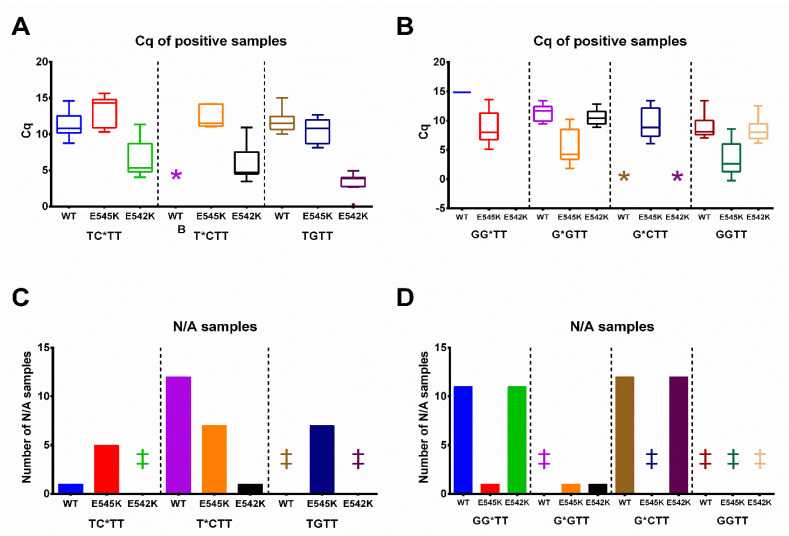
Figure 4.
PIK3CA E542K (A,C) and E545K (B,D) mutation status analysis in FFPE samples. Three types of samples according to dPCR data were used: (1) WT; (2) E542K positive; (3) E545K positive. The clinical samples are coded according to ddPCR mutation status analysis. The mutation percent for the E542K positive samples (left, for TC*TT, T*CTT, and TGTT primers) are indicated as 0.56%, 3.72%, 5.76%, 6.21%, 7.03%, 13.53%, 20.91%. The mutation percent for the E542K positive samples (right, for GG*TT, G*GTT, G*CTT, and GGTT primers) are indicated as 0.56%, 3.72%, 5.76%, 6.21%, 7.03%, 13.53%, 20.91%. (A,B). A Tukey plot of ΔΔCq values from samples with a positive amplification signal. The box always extends from the 25th to the 75th percentiles, and whiskers represent a 1.5-fold interquartile range. The y-axis marks ΔΔCq values: the difference between ΔCq for 1% positive mutation control and the ΔCq value for each sample. The x-axis represents the type of sample (WT, E542K, E545K-positive) and the AS primer. * marks cases with no positive amplification signal and retrieved Cq values. (C,D). The number of samples with negative amplification results and no Cq values (N/A). The y-axis marks the number of negative samples; the x-axis represents the type of sample (WT, E542K, E545K-positive) and the AS primer. ‡ marks cases with no negative samples.

