Figure 1.
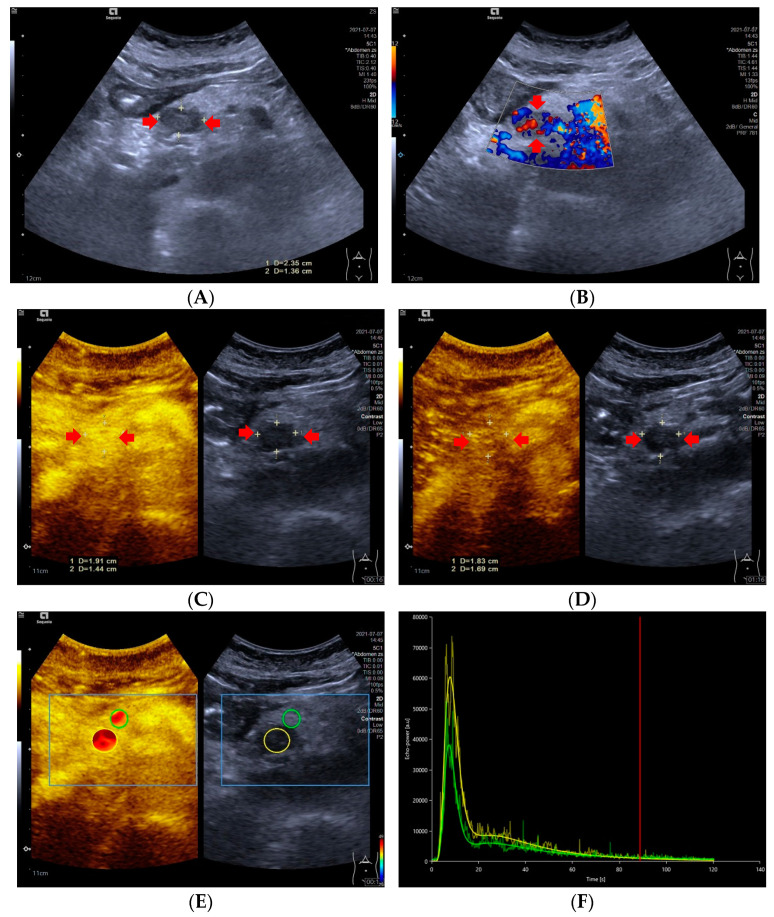
A 59-year-old female with a pNETs G1 lesion (Ki 67 proliferation index of 2%). The pNETs lesion located in pancreatic head was hypoechoic (A) with abundant internal color doppler flow imaging signal (B). After injecting the contrast agent, pNETs lesion showed hyperenhancement in the arterial phase (C) and isoenhancement in the venous phase (D). The pNET’s microvascularization was assessed using VueBox®, an external perfusion software. Regions of interest of the pNETs lesion (yellow circle) and surrounding pancreatic parenchyma (green circle) were placed manually (E). The time intensity curve revealed that in the arterial phase, the yellow curve (pNETs lesion) was higher than the green curve (pancreatic parenchyma), and in the venous phase and late phase, the two curves almost completely overlapped (F).

