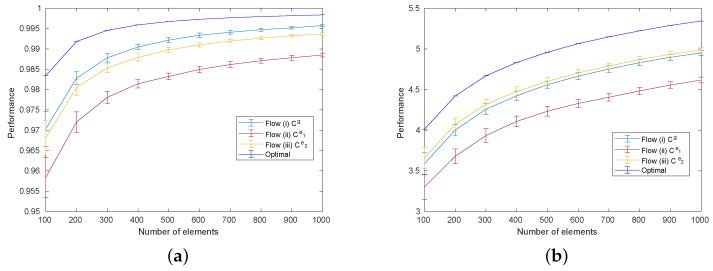
Figure 3.
Comparison of the achieved total compatibility for Flows (i), (ii), and (iii), as described in the caption for Figure 2. Each graph shows the mean and standard deviation of the performance of 100 different compatibility matrices with each given number of elements, simulated under (a) uniform distributions and (b) Poisson distributions.

