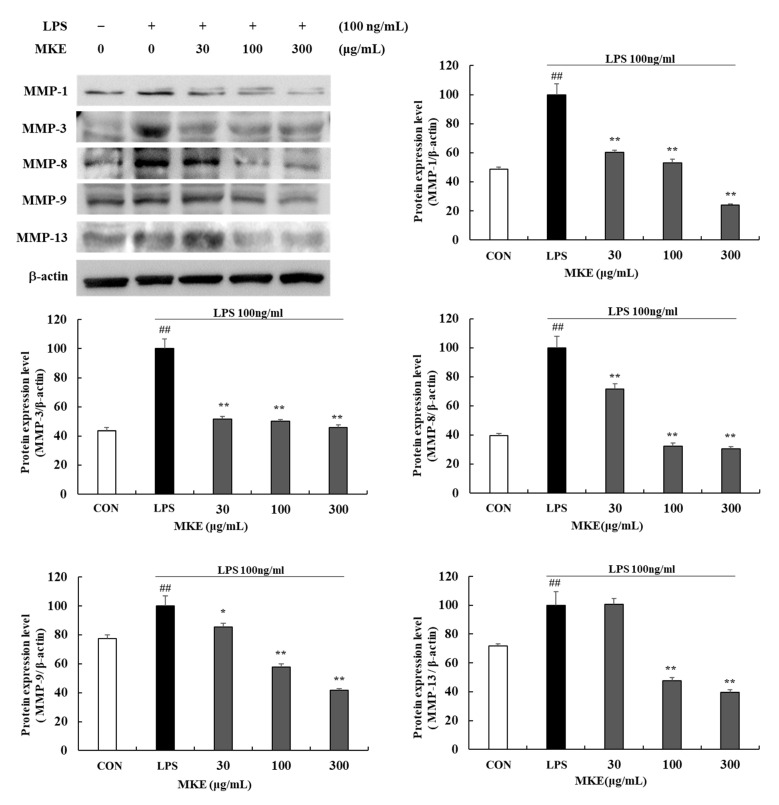
Figure 6.
Effects of MKE (30, 100, and 300 µg/mL) on the production of MMPs in LPS-stimulated RAW 264.7 cells. MKE and 100 ng/mL of LPS was added except for in the vehicle control group and incubated at 37 °C for 24 h. Protein expression levels of MMP-1, MMP-3, MMP-8, MMP-9 and MMP-13 were detected by Western blot. The protein band density was measured by utilizing ImageJ software. β-actin was used as a control. Values represent means ± standard deviation. ## p < 0.01 vs. Vehicle control group; * p < 0.05 and ** p < 0.01 vs. LPS-activated control group.

