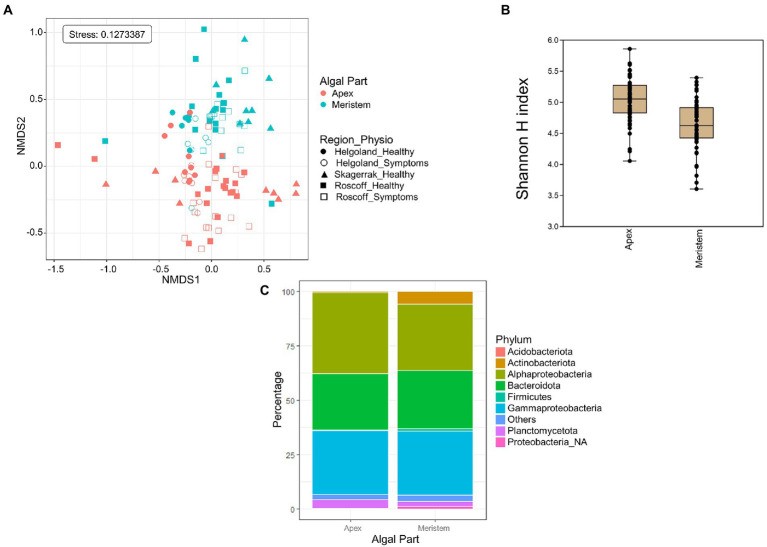
Figure 2.
Algal blade part analysis. (A) NMDS analysis of the microbiome composition. Results show a clear separation of the apex and meristem samples (PERMANOVA, p = 0.001). (B) Box plot of alpha-diversity (Shannon H index) across different sample types calculated at the ASV level. Error bars correspond to the range; n = 111; mean alpha-diversity differs significantly between conditions (t-test, t = 5.47, p < 0.0001; C) Comparison of microbiome composition between apex and meristem samples at the phylum level. Bars show the relative abundance of 16S rRNA gene metabarcoding sequences; all phyla were detected in all sample types, and only their relative abundance varied. Proteobacteria_NA: unclassified as Proteobacteria.

