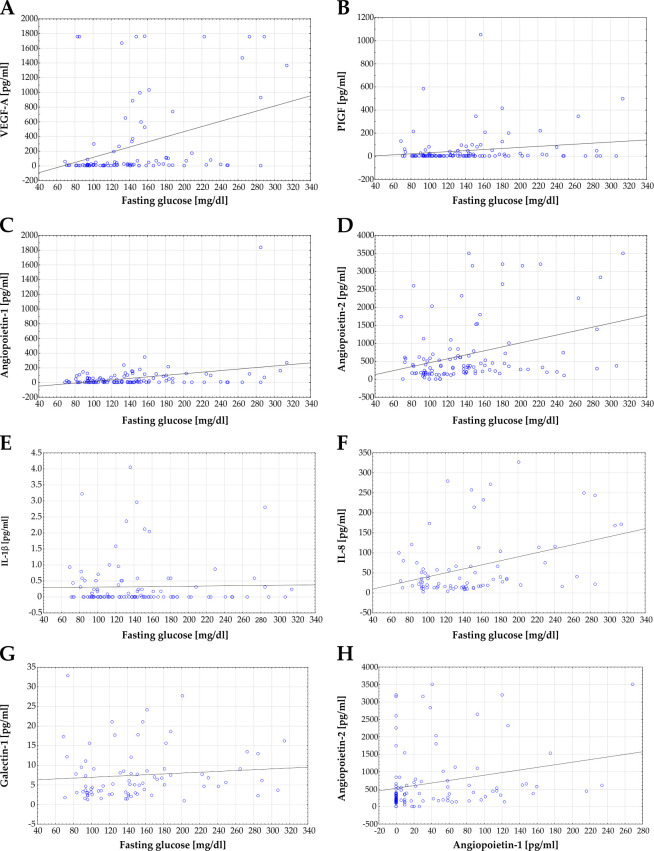
Fig 3. Correlation of protein concentration and fasting glucose level.
A) Correlation analysis of VEGF-A concentration in vitreous humour and fasting glucose level revealed a significant correlation for all samples (r = 0.366; p<0.001; r2 = 0.134). B) Correlation analysis of PIGF concentration and fasting glucose also showed a significant correlation (r = 0.186; p = 0.046; r2 = 0.035). C) Scatterplot of Angiopoietin-1 versus fasting glucose. A significant correlation between Angiopoietin-1 level and fasting glucose level could be observed (r = 0.3275; p<0.001; r2 = 0.076). D) Also, a significant correlation was found between Angiopoietin-2 and fasting glucose level (r = 0.348; p<0.001; r2 = 0.121). E) A correlation between levels of IL-1β and fasting glucose could not be observed (r = 0.023; p = 0.813; r2 = 0.001). F) In contrast, a significant correlation between IL-8 and fasting glucose level was detectable (r = 0.374; p<0.001; r2 = 0,140). G) Scatterplot of Galectin-1 levels and fasting glucose levels revealed no correlation (r = 0.099; p = 0.386; r2 = 0.0098). H) A significant correlation between Angiopoietin-1 and Angiopoietin-2 levels were detectable, excluding one outlier patient (patient #52; r = 0.245; p = 0.011; r2 = 0.060). Each blue dot represents one patient, linear regressions are displayed as solid grey lines.

