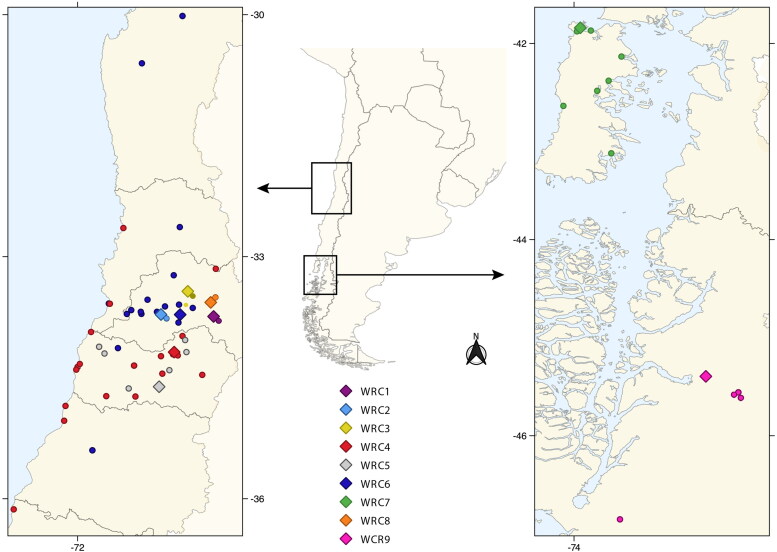
Figure 1.
Geographical distribution of sampled animals. Each dot represents where the animal was found, and each diamond represents the location of Wildlife Rehabilitation Centers (WRC) where the animal was admitted for sampling (WRC1-WRC9). The color of each circle indicates the respective WRC where the animals were sampled.

