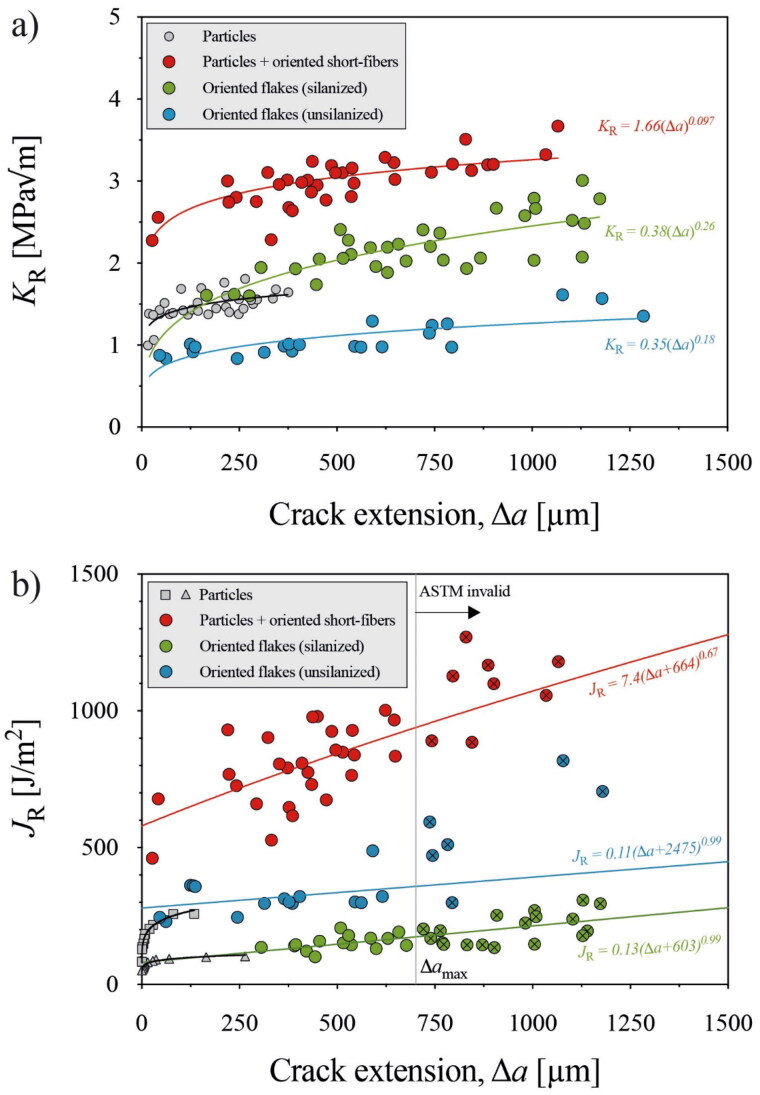
Figure 3.
R-curves of silanized and non-silanized experimental flake-reinforced composites. Fracture toughness is shown in terms of stress intensity KR (a) and nonlinear elastic fracture, JR (b). Included were data on conventional composites (particles, grey dots):KR data taken from Shah et al. [22] (see Figure 3(a)) and JR data from Wendler et al. [6] and De Souza et al. [21] (see Figure 3(b)). Glass-reinforced composite data (particles + orientated short-fibers, red dots) KR and JR from Tiu et al. [5] were added.

