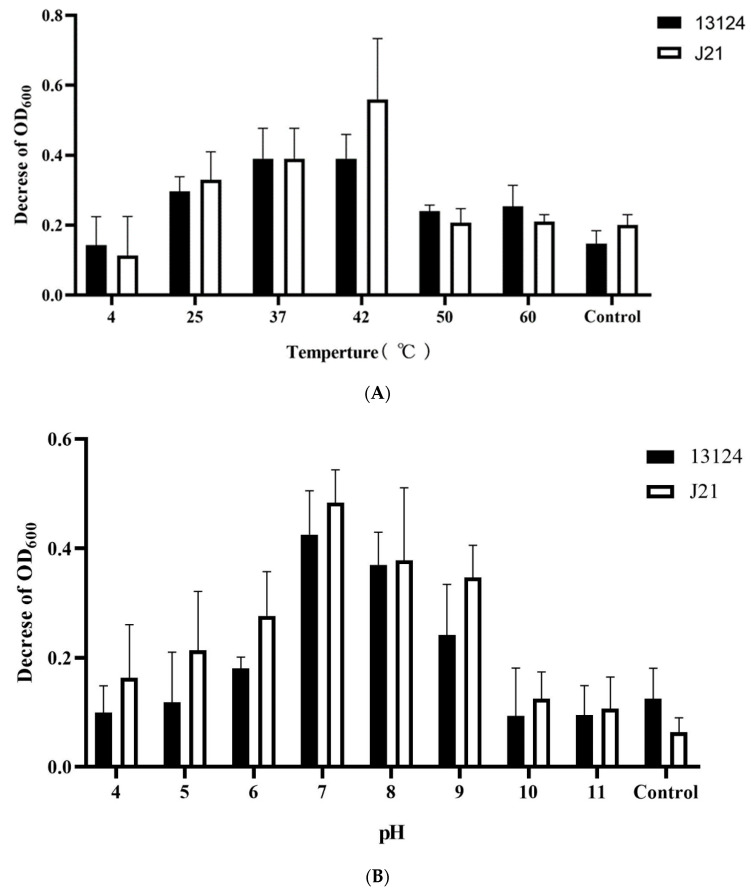
Figure 3.
Lytic activity of endolysin LysCP28 in stress conditions. (A) The tolerance to temperature was measured after previous incubation for 2 h in a range of temperatures. The graph represents the difference between initial and final optical density of cultures treated with temperature-treated endolysin. (B) The activity in different pH levels was determined by analyzing the incubation of LysCP28 and cells over 2 h. The graph represents the difference between the initial and final optical densities of cultures treated with endolysin at different pH levels. OD600 = 0.2 (ATCC 13124, J21 = 2 × 10² CFU/mL), OD600 = 0.4 (ATCC 13124 = 5 × 10⁴ CFU/mL, J21 = 1 × 10⁵ CFU/mL), OD600 = 0.6 (ATCC 13124, J21 = 2 × 10⁷ CFU/mL), and OD600 = 0.8 (ATCC 13124 = 4 × 10⁷ CFU/mL, J21 = 6 × 10⁷ CFU/mL).

