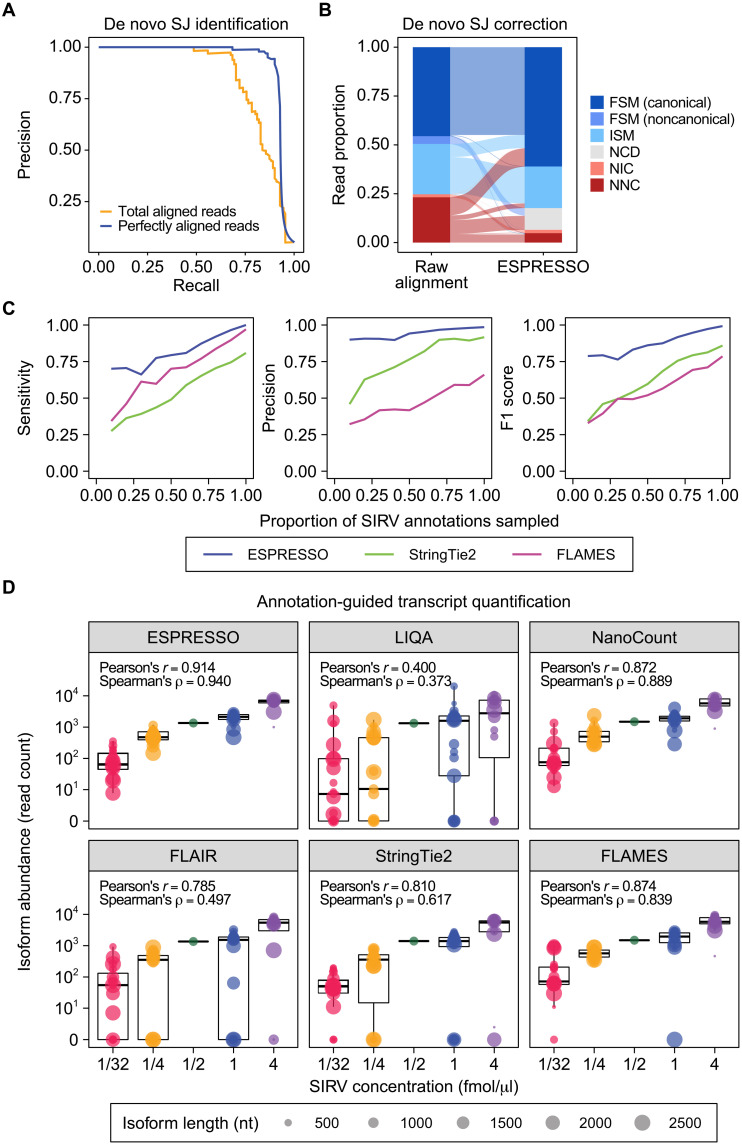
Fig. 2. Evaluation of ESPRESSO using ONT direct RNA-seq data of SIRVs.
(A) Precision-recall curves for de novo SJ identification from raw long-read-to-genome alignments, combined over n = 3 direct RNA-seq replicates, using read count thresholds based on total aligned reads or perfectly aligned reads supporting a given SJ. (B) Distribution of transcript isoform categories among aligned reads, combined over n = 3 direct RNA-seq replicates, before and after de novo SJ correction. FSM or ISM indicates that all SJs in a read are consistent with those in an annotated SIRV transcript, with FSM and ISM reads representing full-length and fragmented reads, respectively. FSM reads are further partitioned into two subcategories (canonical and noncanonical) based on whether they contain SJs without the canonical splice site dinucleotide motif. NIC or NNC indicates a novel combination of annotated or novel splice sites, respectively, and reads classified as NIC or NNC have incorrect transcript structures with respect to SIRVs. NCD reads contain at least one putative SJ in the raw alignment that was evaluated as low-confidence but could not be corrected by ESPRESSO. (C) Sensitivity, precision, and F1 score of ESPRESSO and two other tools (StringTie2 and FLAMES) in discovering SIRV transcripts from direct RNA-seq data (n = 3), using random downsamples of different proportions of SIRV annotations as a guide. Each point represents the mean of three random samplings per downsampling level. (D) Box-and-whisker plots (median and interquartile range) and correlation (Pearson’s and Spearman’s) between known concentrations of 68 SIRV transcripts and their estimated abundances from ESPRESSO and five other tools (LIQA, NanoCount, FLAIR, StringTie2, and FLAMES). For each tool, transcript abundance is reported as the sum of assigned read counts over n = 3 direct RNA-seq replicates. Diameters of points in the box-and-whisker plots are scaled according to transcript length.

