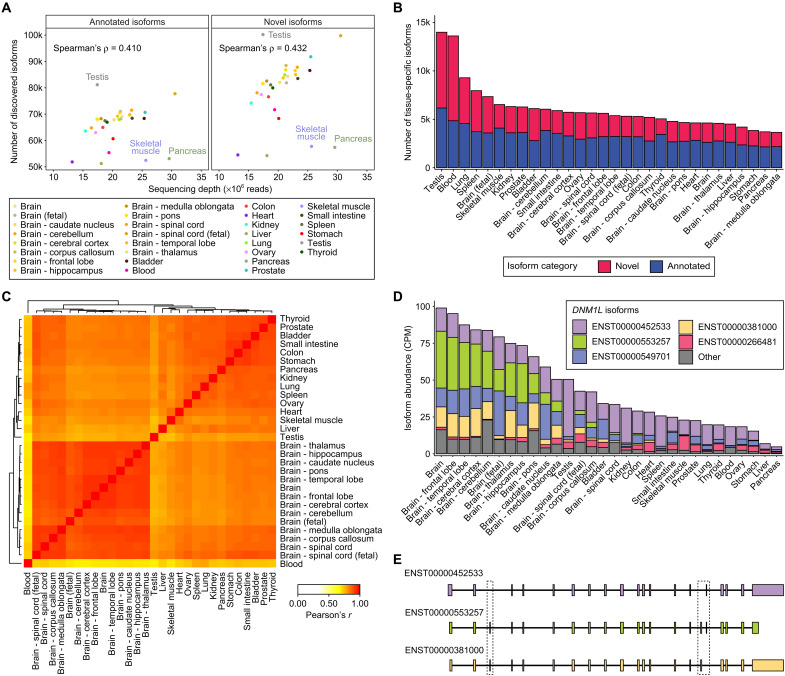
Fig. 6. Characterization of transcript isoforms across 30 human tissues.
(A) Scatterplots showing the Spearman’s correlation between ONT 1D cDNA sequencing depth (×106 reads) and the number of discovered transcript isoforms that are annotated (left column) or novel (right column) for 30 human tissues (14 brain tissues and 16 nonbrain tissues). (B) Stacked barplot showing the number of tissue-specific transcript isoforms [false discovery rate (FDR) < 1%, Materials and Methods] that are annotated (blue) or novel (red) for each of the 30 human tissues. (C) Heatmap displaying pairwise Pearson’s correlations in isoform proportions for tissue-specific transcript isoforms across 30 human tissues. Hierarchical clustering was applied to the correlation matrix to group similar tissues. The correlation heatmap with hierarchical clustering was generated using the heatmap.2 function from the gplots package (v3.1.1) on R (v4.1.0). (D) Stacked barplot showing estimated abundances for transcript isoforms of DNM1L discovered across 30 human tissues. Five DNM1L transcript isoforms with the highest average CPM across 30 human tissues are displayed individually, while the remaining transcript isoforms were grouped together into an Other category. (E) Transcript structures of three DNM1L isoforms—ENST00000452533 (purple), ENST00000553257 (green), and ENST00000381000 (yellow)—displayed in a 5′ to 3′ orientation. Boxes are drawn around transcript regions involving alternative splicing events.

