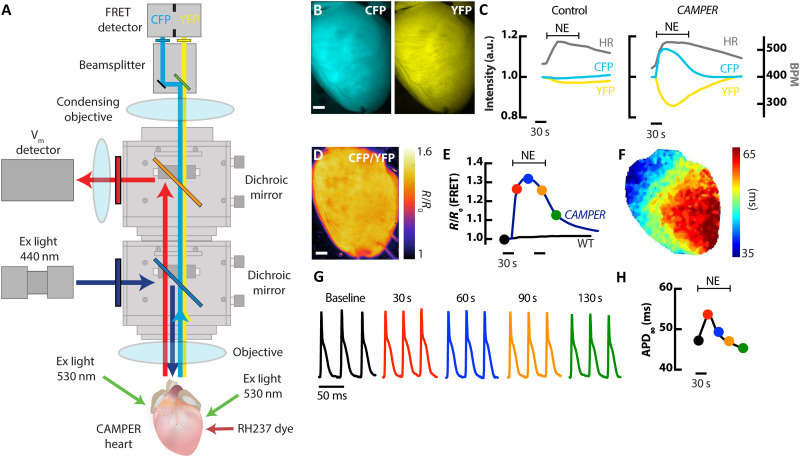
Fig. 2. Development of a whole-heart voltage-FRET imaging system.
(A) Schematic diagram of the macroscale whole-heart FRET and optical mapping system. (B) Representative images of a cardiac-specific CAMPER mouse heart showing CFP and YFP fluorescence. Scale bar, 1 mm. (C) Temporal CFP and YFP fluorescence responses in control and CAMPER mouse hearts after application of a 1.5 μM bolus NE with corresponding changes in HR. (D) Pseudo-colored CFP/YFP ratio image (scale bar, 1mm) and (E) CFP/YFP [normalized to baseline (R0)] ratio changes in response to 1.5 μM NE. (F) Example map of APD (APD80) during sinus rhythm. (G) Example optical APs from the heart in (D) from the time points marked on the FRET ratio graph in (E) and the APD80 graph in (H). (H) Temporal APD80 changes in response to 1.5 μM NE.

