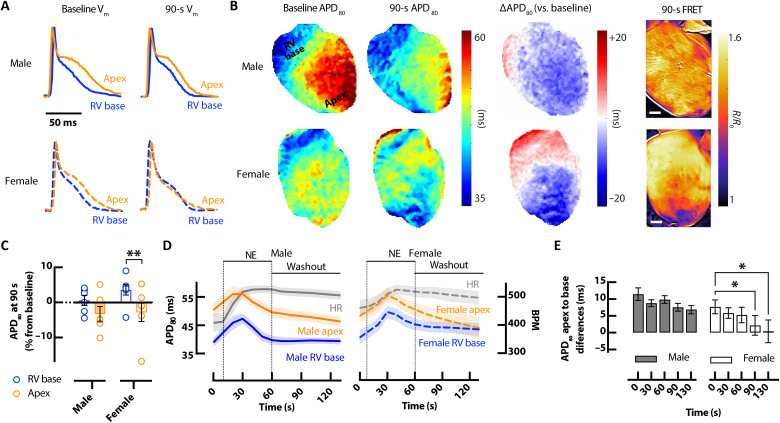
Fig. 5. Sex-dependent differences in AP responses.
(A) Example optical APs at baseline and following bolus of 1.5 μM NE showing shortening of APD in the apex of the female CAMPER mouse heart 90 s after NE. (B) Example APD80 maps (left) with change in APD80 at 90 s versus baseline (∆APD80) (middle) and corresponding cAMP ∆FRET ratio images at the same time points (right). Scale bars, 1 mm. (C) APD80% change from baseline (time 0) at 90 s after NE. (D) Average (mean = solid lines; SEM = shadow) temporal APD80 in response to bolus of 1.5 μM NE from RV base (blue) and apex (orange), with corresponding changes in HR (gray). (E) Average APD80 apex-to-base differences in male (closed bar) and female (open bar) hearts corresponding to time points in (D). N = 6 male and 7 female hearts. *P < 0.05, by two-way ANOVA with multiple pairwise comparisons.

