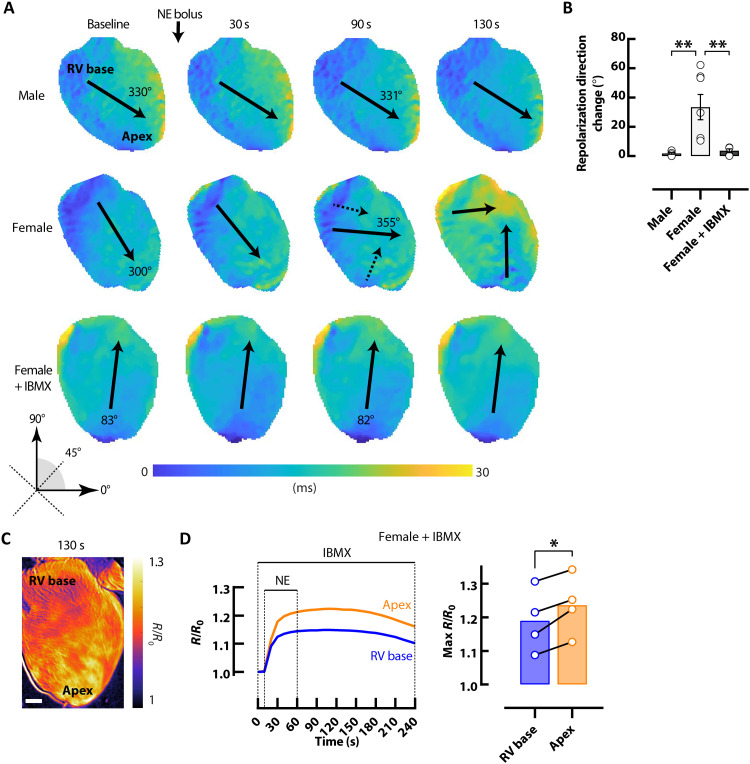
Fig. 6. Changes in the direction of repolarization in female hearts.
(A) Representative repolarization maps demonstrate directional changes in female but not male hearts following bolus of 1.5 μM NE. Repolarization directional changes did not occur with bolus of NE in female hearts following pretreatment with 100 μM IBMX. Solid arrows represent mean repolarization angle. (B) Mean angular repolarization direction change with bolus of 1.5 μM NE. N = 6 male and 5 to 7 female hearts. (C) Representative ∆FRET ratio image showing cAMP activity in a female CAMPER heart in response to 1.5 μM NE bolus during perfusion with 100 μM IBMX. Scale bar, 1 mm. (D) Corresponding representative FRET ratio traces and mean scatter dot plots from RV basal (blue) and apical (orange) regions following bolus of 1.5 μM NE during perfusion with 100 μM IBMX. N = 4 female hearts. *P < 0.05 and **P < 0.01, by one-way ANOVA or paired t test.

