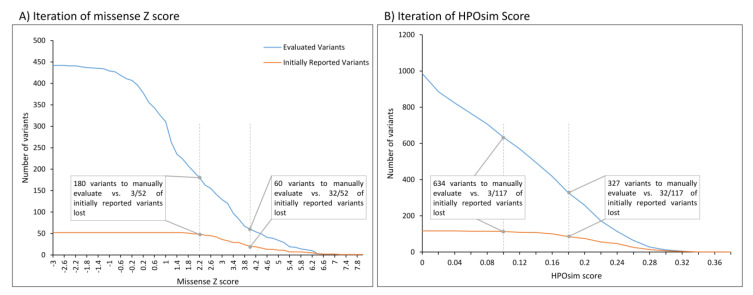
Figure 3.
Iteration of missense Z score and HPOsim score. Number of variants to be manually evaluated (blue) and of initially reported (L)P variants (orange) based on missense Z score thresholds (A) and HPOsim score thresholds (B) as a single filter criterion. A) Depicted lines mark the adapted cut-off of 2.2 and the previously set cut-off of 4.0. B) Depicted lines mark the applied cut-off of 0.1 and an exemplary cut-off of 0.18. Notably, not all variants have an HPOSim score.

