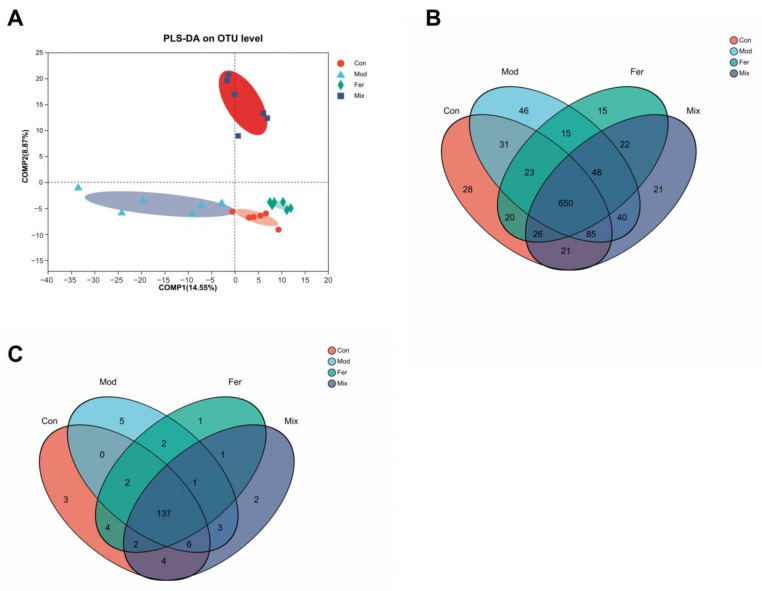
Figure 6.
Gut microbiota diversity in different groups. The contents of rats’ ceca were collected, sequenced, and evaluated for community structure. Differences in gut microbiota diversity across groups were determined by using PLS−DA analysis (A). The Venn diagram depicts the number of common and individual OTUs (B) and genera (C).

