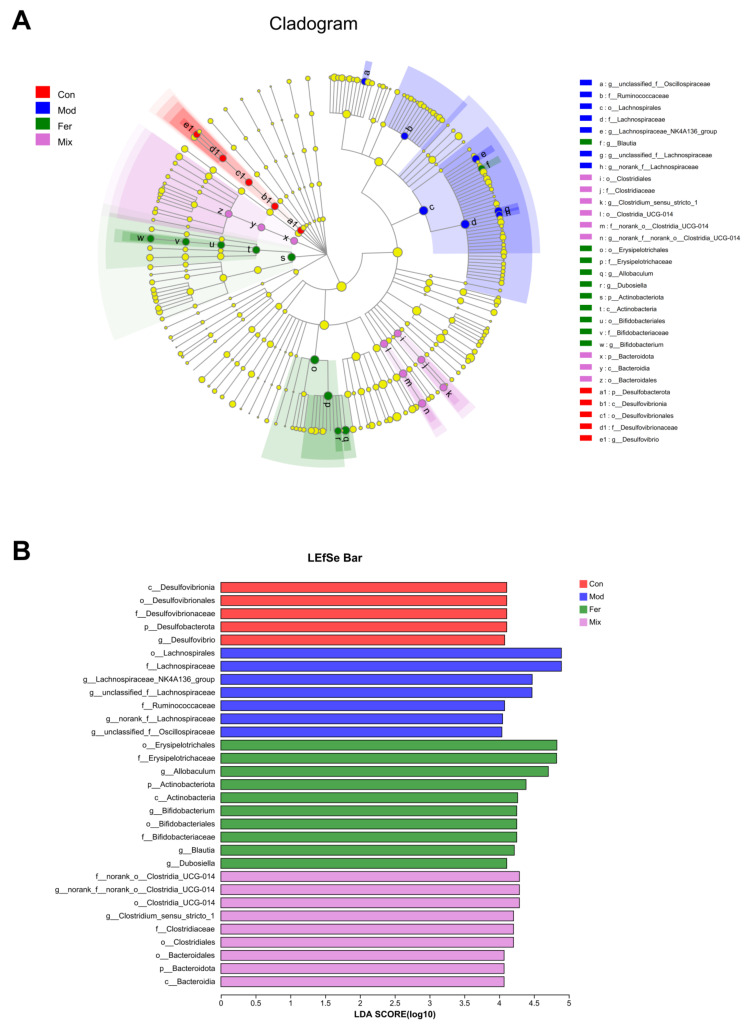
Figure 7.
Changes in gut microbiota at different levels and interactions between them. LEfSe analysis was performed to identify the taxa that changed significantly. A cladogram (A) was used to analyze the changes in the gut microbiota occurring in each group across taxa, and LDA score histograms (B) were used to analyze the bacterial markers in each group.

