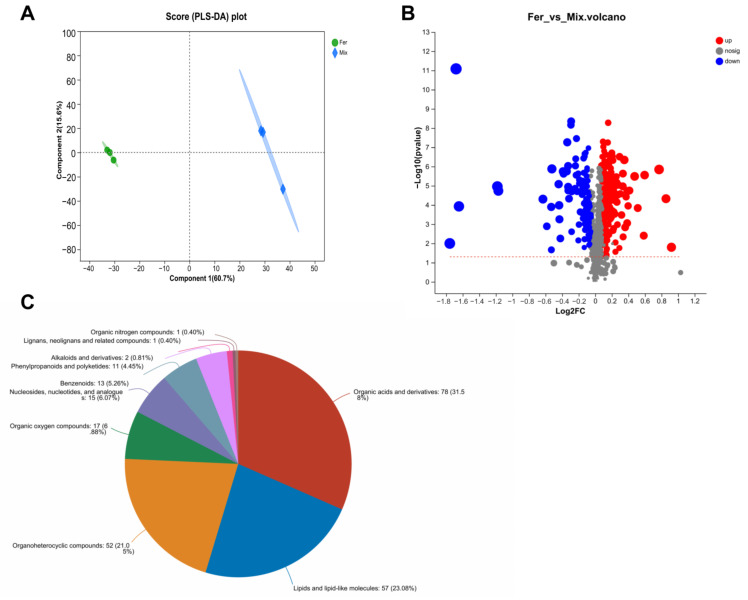
Figure 9.
Analysis of differential metabolites. PLS−DA analysis (A) was performed to show the variation in metabolites diversity between the Fer and Mix groups. A volcano plot (B) was used to analyze the differential metabolites in the Fer and Mix groups. Gray dots denote non−significant differential metabolites, blue dots denote significantly downregulated metabolites (p < 0.05), and red dots denote significantly upregulated metabolites (p < 0.05). HMDB compound classification analysis (C) was used to classify and annotate differential metabolites.

