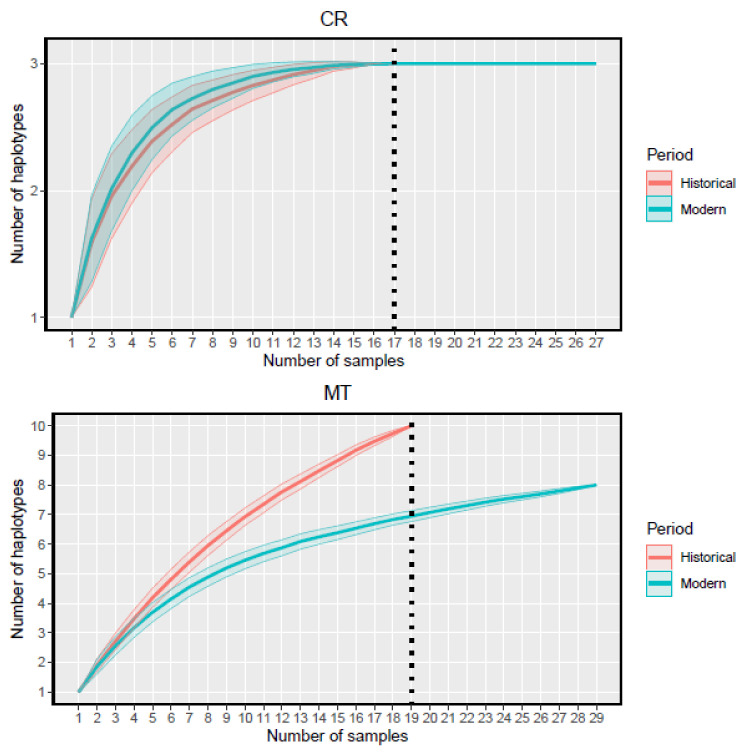
Figure 2.
Haplotype accumulation for control region (CR) and near-complete mitochondrial DNA sequences (MT) for historical (red) and modern Iberian wolves (blue). Average estimated from 1000 randomizations. Color dashed lines and filled area indicate standard error. Vertical black dashed line indicates the lowest number of sequences sampled for each fragment.

