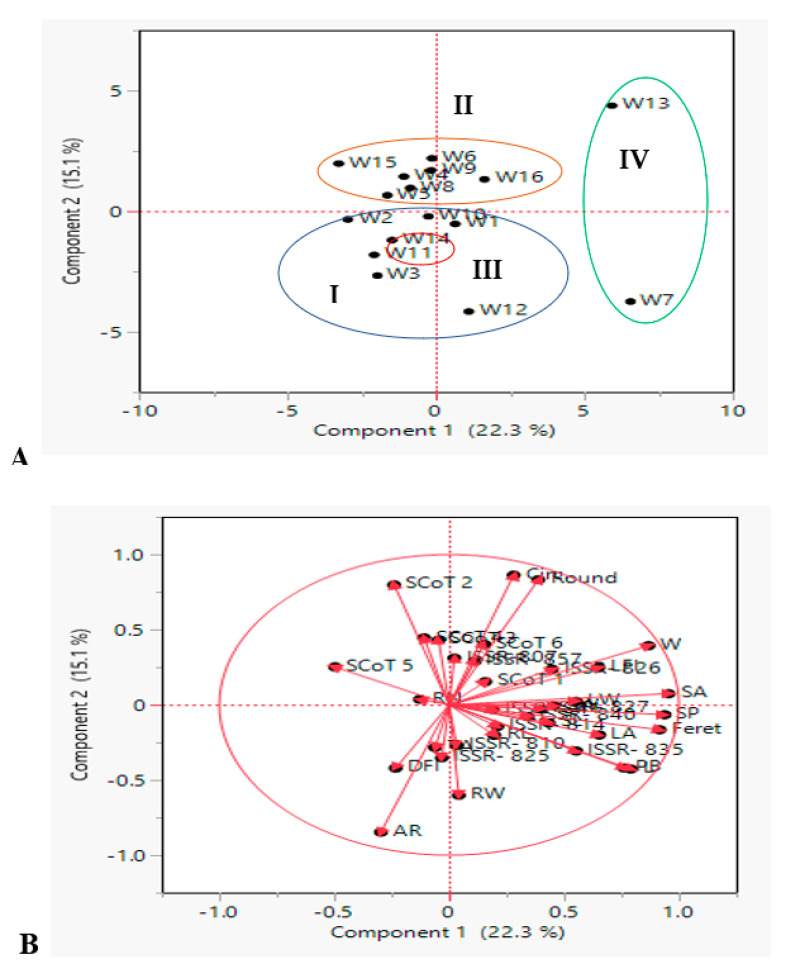
Figure 5.
Principal component analysis (PCA) illustrating the genetic diversity expressed by the grouping of 16 Egyptian T. aestivum cultivars based on the analysis of 19 morphometric traits, 10 ISSR and 6 SCoT primers polymorphism (A) scatter plot analysis showing four clusters (Cluster I, II, III and IV represent as blue, orange, red and green oval shapes, respectively); (B) the interrelationship among all measured morphological and molecular marker parameters. The dots are genotypes and the vectors (red arrows) are parameters.

