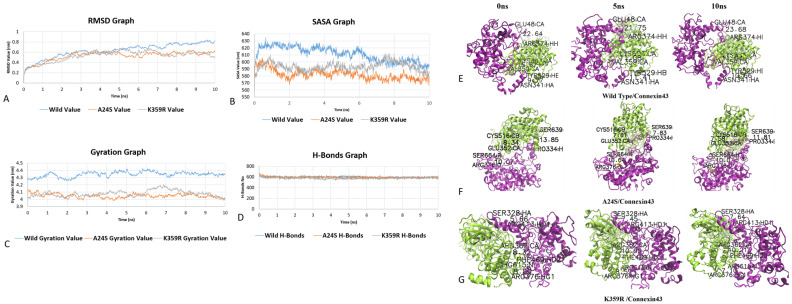
Figure 3.
Analysis of simulation trajectory of native (Blue) and mutant structures A24S (Orange) and K359R (Gray) of PKCγ bound to connexin 43: (A) Root mean squared deviation (RMSD) plot for each trajectory over each 10 nanosecond production run, wild-type proteins have a higher RMSD value than mutant A24S and K359R. (B) The solvent-accessible surface area (SASA) analysis showing the more exposed surface area of wild and buried surface area for both mutants. (C) Radius of gyration of PKCγ and bound protein connexin 43 during the simulation run. Wild proteins have larger gyration values showing loose interaction, while both mutant A24S and K359R have smaller gyration values showing strong interaction with connexin 43. (D) H-bonds formed over the simulation run. (E) Two-dimensional (2D) view of the distance between hydrogen bond interaction of wild PKCγ (Green) with connexin 43 (purple) at different intervals. (F) Two-dimensional (2D) view of the distance between hydrogen bond interaction of Variant A24S PKCγ (green) with connexin 43 (purple) at different intervals. (G) Two-dimensional (2D) view of the distance between hydrogen bond interaction of variant K359R PKCγ (green) with connexin 43 (purple) at different intervals.

