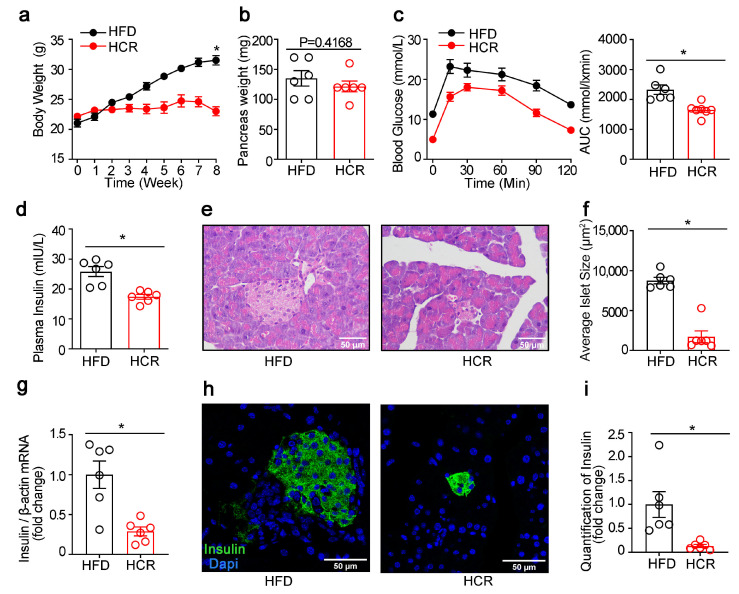
Figure 4.
CR decreased insulin production in diabetic mice. (a) Body weight curves of CR-treated high-fat diet-fed mice. (b) Weight of pancreas. (c) Intraperitoneal glucose tolerance test. (d) Plasma insulin at 15 min after glucose injection. (e) HE staining of pancreatic sections. (f) Quantification of islet size. (g) Insulin mRNA. (h) Immunofluorescence staining for insulin (green) in the pancreas of mice fed with HFD or HCR. (i) Quantification of insulin. The results were expressed as mean values ± SEM. (six mice per group), * p < 0.05 vs. HFD mice.

