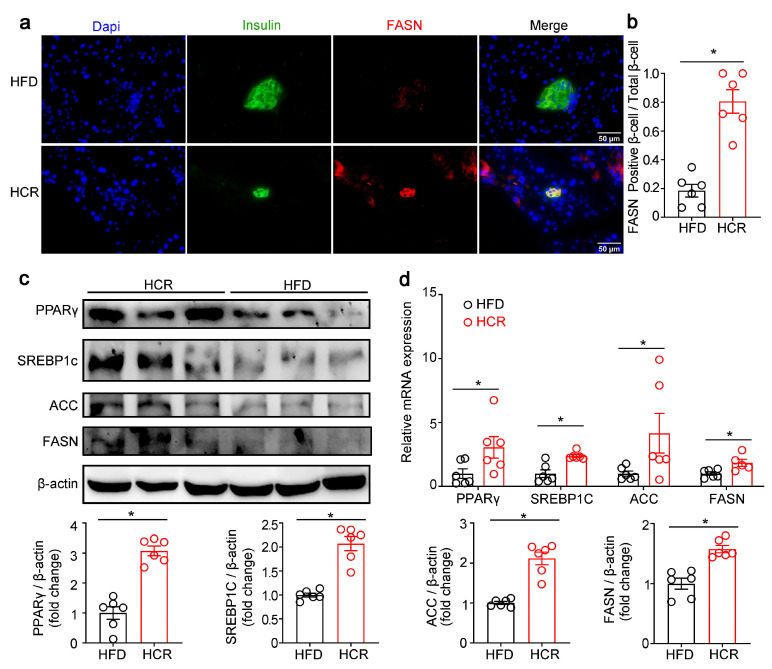
Figure 6.
CR stimulated the lipogenic gene expression in pancreas of high-fat diet-fed mice. (a) Representative immunofluorescence images of fatty acid synthase (FASN, red) and insulin (green). (b) Quantification of FASN-positive β-cells/total β-cells. (c) Representative Western blot from HFD or HCR mouse pancreas. PPARγ, SREBP1c, ACC, and FASN were measured. Quantification of PPARγ, SREBP1c, ACC, and FASN. (d) PPARγ, SREBP1c, ACC, and FASN mRNA levels. The results were expressed as mean values ± SEM. (six mice per group), * p < 0.05 vs. HFD mice.

