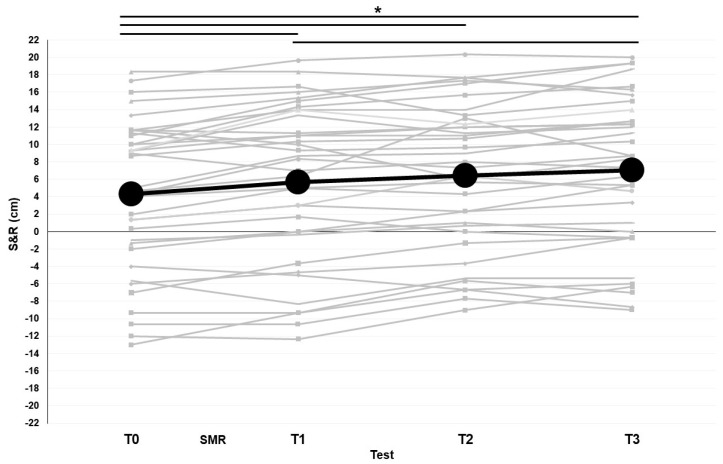
Figure 4.
S&R values modifications over time before and after the SMR intervention. The black fat line represents the average values and thin grey lines are the real values of each participant. T0: test before intervention. T1: test after intervention. T2: test 30 min after intervention. T3: test 60 min after intervention. SMR: self-myofascial release. * Significant differences with p < 0.05.

