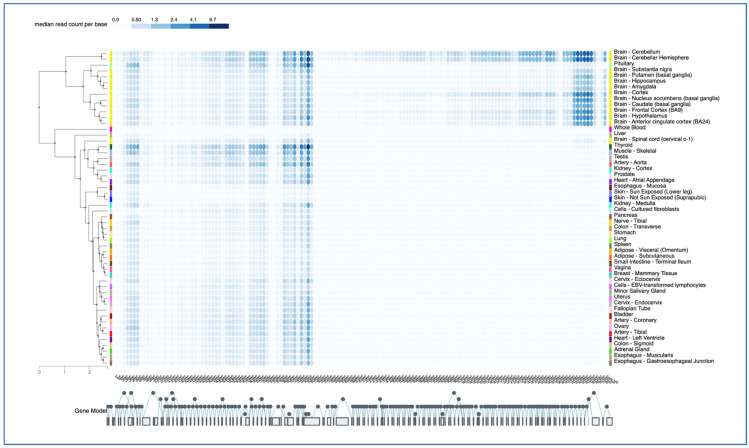
Figure 5.
GTEX Exon expression pattern. The GTEX portal was used in the exon expression mode to examine exon-specific transcripts in tissues, color-coded as in Figure 4, and listed in alphabetically order. The 145 exons of the SNHG14 gene are shown below, with alternative and sequential splicing noted by the filled circles. Alternative splicing is shown as circles above and below the main circles, which are sequential. The Genotype-Tissue Expression (GTEx) Project [28] was supported by the Common Fund of the Office of the Director of the National Institutes of Health and by NCI, NHGRI, NHLBI, NIDA, NIMH, and NINDS. The data used for the analyses described in this manuscript were obtained from the GTEx Portal on 12/28/22. The color code corresponds to read counts per base per exon.

