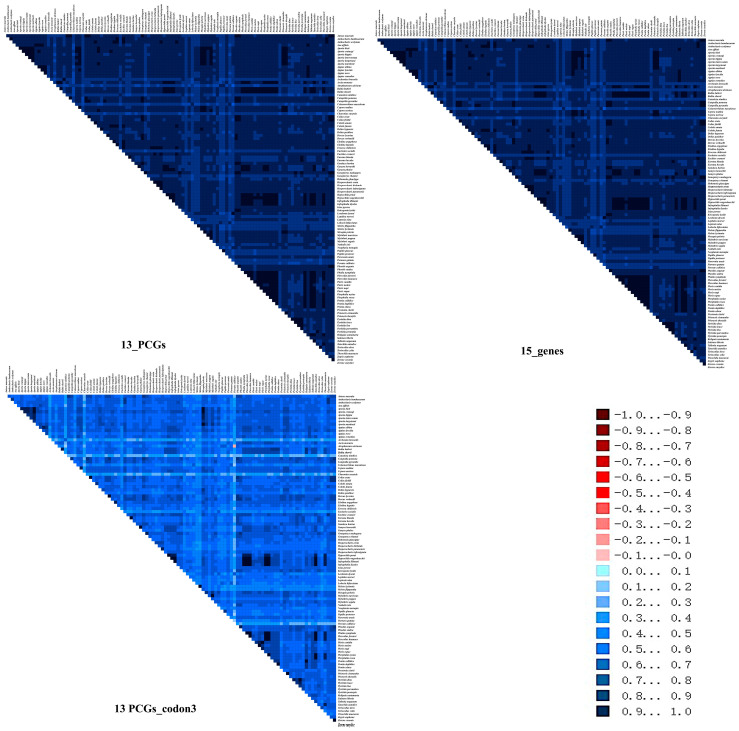
Figure 5.
Heterogeneous sequence divergence of mitochondrial genomes for different datasets. The mean similarity score between sequences is represented by a colored square. The scores range from −1, indicating full random similarity, to +1, indicating non-random similarity, which is visualized by a color range from dark red (−1) to dark blue (+1).

