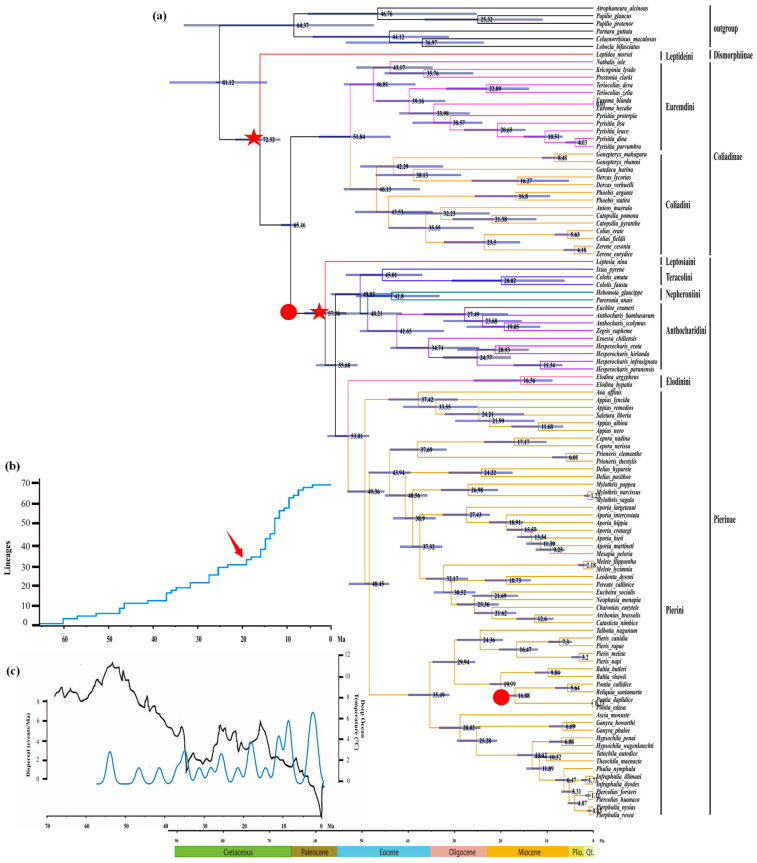
Figure 7.
Estimated divergence dates and diversification rate of Pieridae and their association with geological and climatic events: (a) estimated time tree of the Pieridae; the blue bars represent 95% posterior density intervals for the node age, and placement of two fossil calibrations and two secondary calibrations are indicated by red circles and red stars, respectively); (b) the LTT plot of Pierinae diversification, and the point of a sharp increase are marked with a red arrow; (c) climatic–dispersal curve for Pierinae. Deep ocean temperatures (black curve, as a proxy for global temperature) were derived from oxygen isotopes corrected for variation in global ice volume; the time–event curve (blue curve) shows the changes in the frequency of dispersal.

