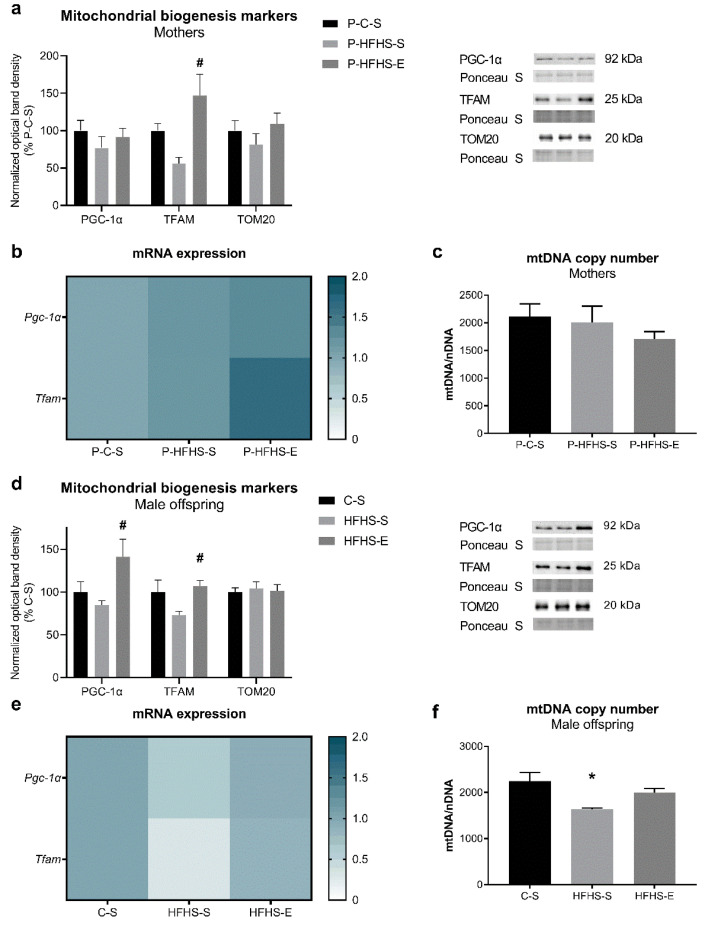
Figure 2.
Effects of maternal HFHS and GE on different markers of liver mitochondrial biogenesis in mothers: (a) relative content of PGC-1α, TFAM, and TOM20, (b) heat map showing the relative expression levels for Pgc-1α and Tfam transcripts, (c) mitochondrial DNA copy number, (g) principal component analysis of hepatic mitochondrial biogenesis markers; and in offspring: (d) relative content of PGC-1α, TFAM, and TOM20, (e) heat map showing the relative mRNA expression levels of Pgc-1α and Tfam, (f) mitochondrial DNA copy number, (h) principal component analysis of hepatic mitochondrial biogenesis markers. GE—gestational exercise; C—mothers fed with control diet; HFHS—mothers fed with high-fat high-sucrose diet; S—sedentary mothers; E—exercised mothers. * vs. P-C-S (p < 0.05) or vs. C-S (p < 0.05) in mothers or offspring, respectively. # vs. P-HFHS-S (p < 0.05) or vs. HFHS-S (p < 0.05) in mothers or offspring, respectively.


