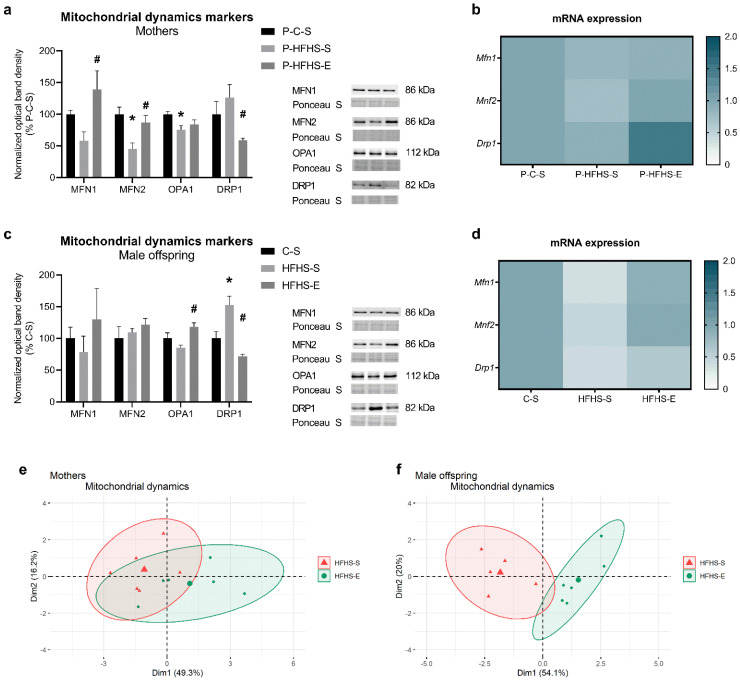
Figure 3.
Effects of maternal HFHS and GE on different markers of liver mitochondrial dynamics in mothers: (a) relative mitochondrial content of MFN1, MFN2, OPA1, and DRP1, (b) heat map showing the relative transcripts for Mfn1, Mfn2, and Drp1, (c) principal component analysis of hepatic mitochondrial dynamics markers; and in the offspring: (d) relative mitochondrial content of MFN1, MFN2, OPA1, and DRP1, (e) heat map showing the relative hepatic transcripts for Mfn1, Mfn2, and Drp1, (f) principal component analysis of hepatic mitochondrial dynamics markers. GE—gestational exercise; C—mothers fed with control diet; HFHS—mothers fed with high-fat high-sucrose diet; S—sedentary mothers; E—exercised mothers. * vs. P-C-S (p < 0.05) or vs. C-S (p < 0.05) in mothers or offspring, respectively. # vs. P-HFHS-S (p < 0.05) or vs. HFHS-S (p < 0.05) in mothers or offspring, respectively.

