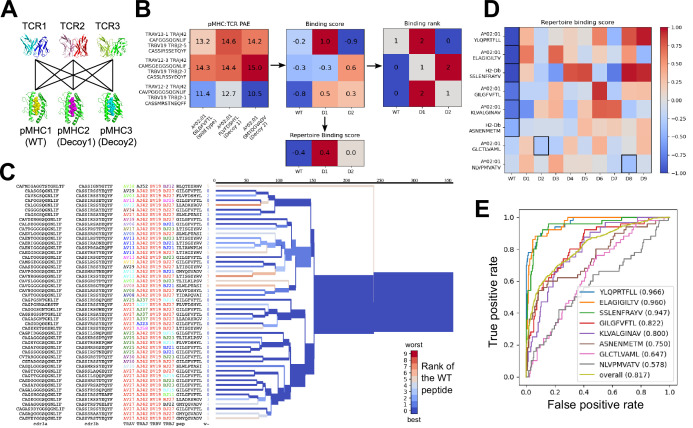
Figure 3. Structural modeling can sometimes discriminate correct from incorrect TCR:pMHC pairings.
(A) For each of the eight peptide:MHC epitopes, we docked multiple cognate TCRs against multiple decoy peptides and the wild type epitope. Here three TCRs and three pMHCs are shown; 9 decoys and up to 50 TCRs were actually modeled. (B) For each candidate TCR:pMHC pairing, the mean AlphaFold predicted aligned error (PAE) for the TCR:pMHC interface was calculated (left) and transformed into a binding score by subtracting out TCR-intrinsic and pMHC-intrinsic factors (middle). These binding scores were averaged to define a repertoire-level binding score for the WT epitope and each of the decoys (bottom). Also calculated was the rank of the WT binding score within the list of all the binding scores for each TCR (right). (C) TCRdist hierarchical clustering tree of the 50 modeled TCRs for the A*02:01 GIL9 epitope, labeled with the TCR sequence information, top-ranked peptide, and rank of the WT peptide, and colored by the rank of the WT peptide. Internal edges, which correspond to multiple ‘leaf’ TCRs, are colored by the rank of the WT peptide after averaging the binding scores over the leaf TCRs. (D) Repertoire binding scores for each of the eight target epitopes and the 9 decoy peptides, with the lowest (most favorable) binding score in each row boxed. (E) Receiver operating characteristic (ROC) curves for discrimination of WT from decoy peptides by binding score. Area under the ROC curve (AUROC) values are given in the legend along with the sequence of the WT peptide.

