. 2023 Jan 20;12:e82813. doi: 10.7554/eLife.82813

Figure 6. Alanine scanning results for the eight benchmark epitopes.

(A) Heatmaps showing the binding scores for the wild type peptide (left column) and all single-alanine mutants (columns labeled with the wild type sequence) in complex with each TCR (rows). Below each heatmap, the wild type pMHC crystal structure is shown with the peptide colored by the delta between mutant and wild-type repertoire-averaged binding scores. (B) Line plots of the delta between the mutant and wild-type repertoire-averaged binding scores reflect the predicted repertoire-level sensitivity to epitope mutations.

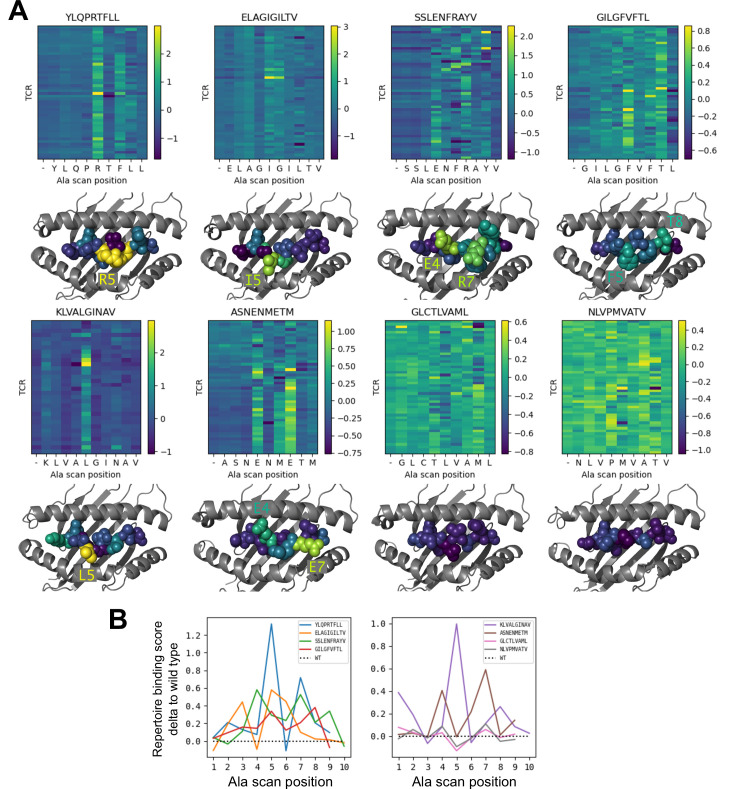
Figure 6.

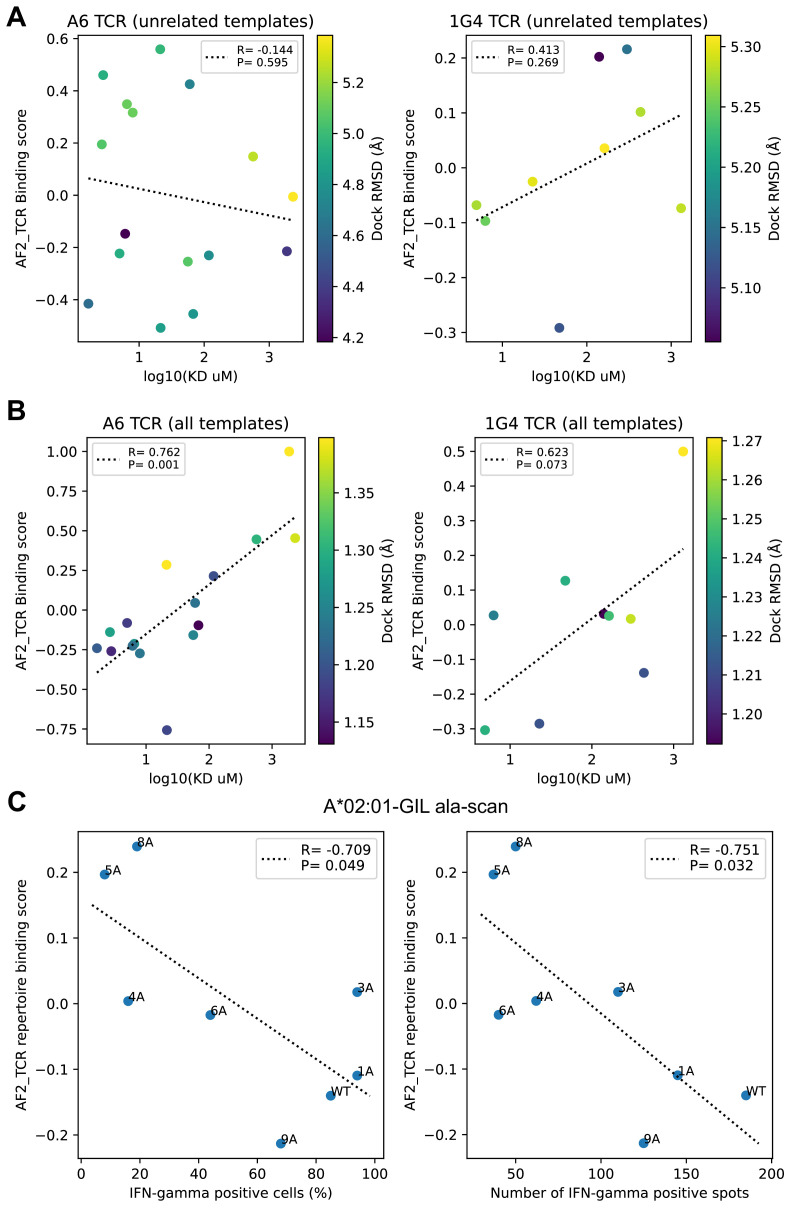
Figure 6—figure supplement 1. Comparison to experimental data on single TCRs binding altered peptide ligands.

Figure 6—figure supplement 1.

(A–B) Experimental binding affinities for the A6 and 1G4 TCRs were taken from Pettmann et al., 2021 Figure 1 source data, 'Bmax constrained' KD values. (A) Binding predictions generated without related templates show poor correlation with experiment (lower binding scores and lower KD values correspond to tighter binding, so we would expect to see a positive correlation). (B) Inclusion of related templates in the modeling pipeline leads to improved binding predictions. (C) Activation data for single-alanine mutants of the A*02:01 restricted M158 epitope were taken from Figure 4 (Berkhoff et al., 2005) and plotted against the repertoire-level binding score for the M158 epitope (GILGFVFTL) from our alanine scanning simulations (Figure 6). Here, we see the expected association between lower binding scores (i.e. stronger predicted binding) and higher levels of activation, though the correlation is relatively weak.