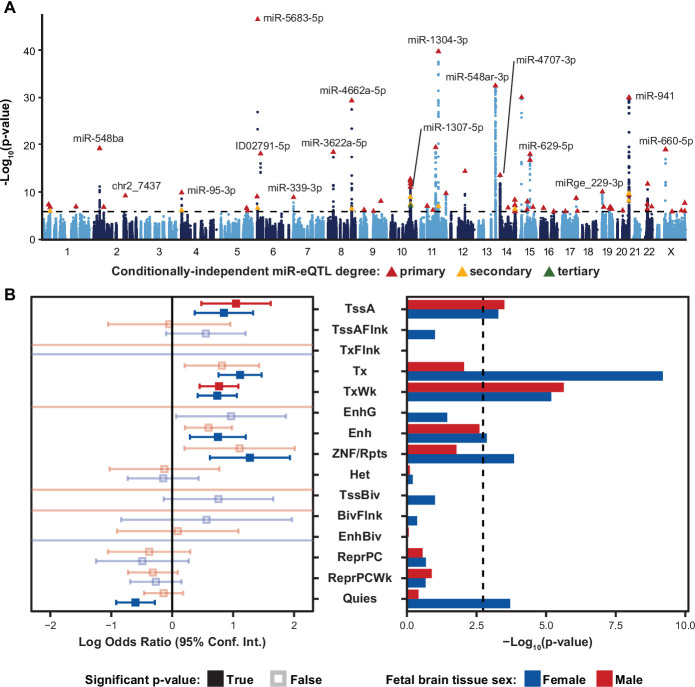
Figure 2. Local-miRNA-eQTLs and their enrichment in functional chromatin.
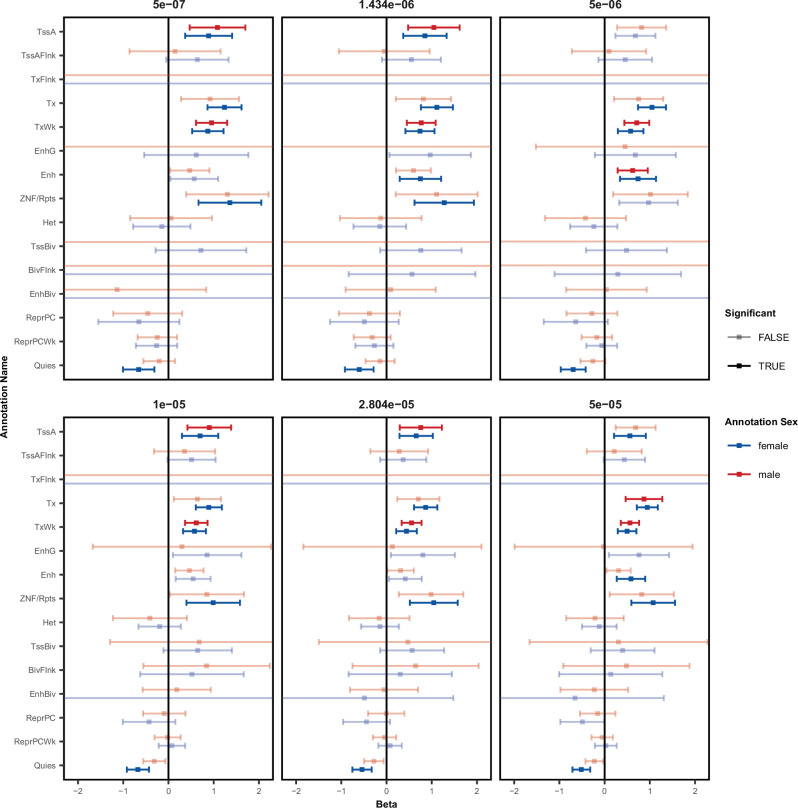
(A) Manhattan plot showing -Log10(p-values) for variants in a 2 Mb window around each expressed miRNA. Index variants for 70 primary, 14 secondary, and 1 tertiary eQTL denoted by triangles and colored by degree by which the eQTL is conditionally independent. Variants tested for association to more than one expressed miRNA are represented by independent points for each association p-value. Dotted line represents a stringent p-value significance threshold of 1.434x10⁻⁶ after local and global multiple testing correction at FDR <5%. (B) Enrichment of local-miRNA-eQTLs within functionally annotated chromatin states. Local-miRNA-eQTLs passing the stringent p-value significance threshold were used for enrichment analysis. For other p-value significance thresholds, see Figure 2—figure supplement 1. Chromatin states were predicted using ChromHMM for both male and female fetal brain tissue. Left, log odds ratio and 95% confidence interval for significant enrichments are in solid colors. Non-significant enrichments in faded color outlines. Right, -Log10(p-values) for each enrichment test. Dotted line represents a multiple testing corrected p-value threshold of 1.83x10⁻³ (Bonferroni correction at α<0.05). miRNA-eQTLs are significantly enriched within active transcription start sites (TssA) and chromatin associated with strong transcription (Tx), weak transcription (TxWk), enhancers (Enh), and ZNF genes and repeats (ZNF/Rpts). There is also a significant depletion of miRNA-eQTLs within quiescent chromatin (Quies). Other abbreviations: flanking active tss (TssAFlnk), transcription at gene 5’ and 3’ (TxFlnk), genic enhancers (EnhG), heterochromatin (Het), bivalent/poised TSS (TssBiv), flanking TssBiv (BivFlnk), bivalent enhancer (EnhBiv), repressed polycomb (ReprPC), and weak repressed polycomb (ReprPCWk).


