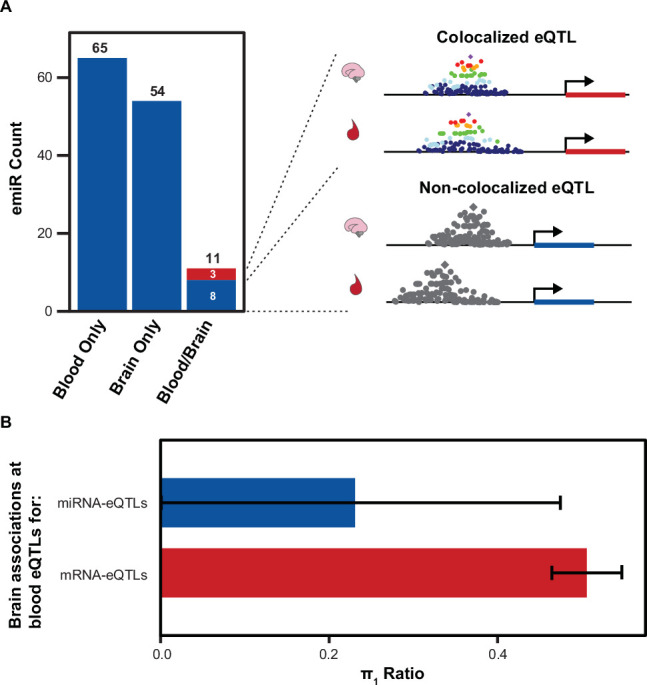
Figure 4. Comparison of Brain and Blood miRNA-eQTLs.

(A) MiRNAs with significant associations, emiRs, separated by unique to blood, unique to brain, or shared. Three of 11 shared emiRs have co-localized genetic signals in the blood and brain datasets. Cartoon locus dot-plot shows a representation of a colocalized genetic signal or a non-colocalized signal for a miRNA-eQTL that is present in both tissues. (B) The fraction of brain eQTL associations that are estimated non-null associations within the blood eQTL dataset (π1) separated by miRNA-eQTLs and mRNA-eQTLs. Error bars represent 95% upper and lower confidence intervals after 100 bootstrap samplings.
