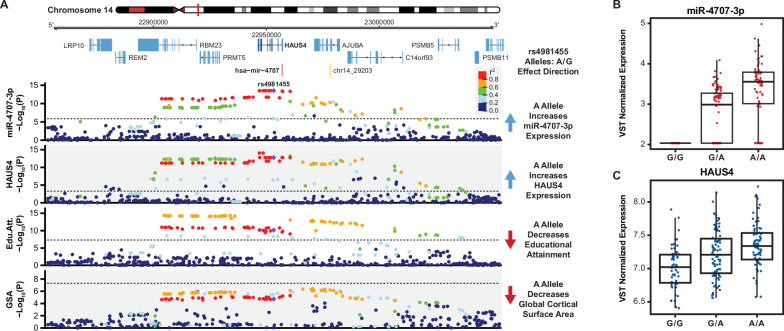
Figure 5. A miRNA-eQTL for miR-4707–3p colocalizes with multiple brain traits.
(A) A locus dot-plot surrounding hsa-mir-4707 on chromosome 14 showing -Log10(p-value) for various associations. Top track shows associations for expression of miR-4707–3p with the index variant, rs4981455. The second track shows associations surrounding a significant mRNA-eQTL to HAUS4 expression. The third track shows associations at this locus for a GWAS to educational attainment. The fourth track shows variant associations to global cortical surface area (GSA). Variants are colored by pairwise linkage disequilibrium (LD, r2) to rs4981455 in each of the four tracks. Dotted line in the first and second tracks represent a stringent p-value significance threshold of 1.43x10⁻⁶ and 8.17x10⁻⁴ respectively after local and global multiple testing correction at FDR <5%. Dotted lines in bottom two tracks represents the global genome-wide significance threshold of 5x10⁻⁸. (B) Boxplot showing variance stabilizing transformed (VST) expression of miR-4707–3p for samples with the indicated genotype at rs4981455. Samples with the G/G genotype show no expression of miR-4707–3p. (C) Boxplot showing VST expression of HAUS4, the host gene for mir-4707, at rs4981455.


