. 2023 Jan 11;12:e79488. doi: 10.7554/eLife.79488

Figure 6. MiR-4707–3p overexpression in differentiating phNPCs.

(A) Experiment overview. Primary human neural progenitor cells (phNPCs) from donor 54 (D54, genotype G/G at rs4981455) were transduced with pTRIPZ-mir-4707-EGFP (mir-4707) or a control pTRIPZ-EGFP and selected with puromycin to form stable lines in proliferation media. Stable lines were then plated in 6-well and 96-well plates into differentiation media with doxycycline to induce expression of miR-4707-3p+EGFP or control (EGFP only). At 1 and 2 weeks post plating in differentiation media, RNA was extracted from 6-well plates for qPCR and microarray experiments, and 96-well plates were fixed for ICC. (B) At 1 and 2 weeks post plating in differentiation media, D54 cells transduced with mir-4707 showed increased expression of miR-4707–3p as compared to control cell lines. p-Values from a two-sided t-test on 6 samples (wells) per condition. (C) Gene ontology analysis using all differentially expressed genes between mir-4707 and control cells at week 2 as seen in D. Enrichment p-values corrected by FDR. Dotted line represents an FDR corrected p-value of 0.05. (D) Differential mRNA expression between mir-4707 cells and control cells as measured by microarray assay at week 2. Positive log2 fold change indicates increased expression in control cells and decreased expression in mir-4707 cells. Selected genes are computationally predicted to be targets of miR-4707–3p and were down-regulated in mir-4707 cells at both 1 and 2 weeks. (E) Representative images from D54, week 2, mir-4707 and control cell lines stained with GFP, the neural progenitor marker NESTIN (NES), the neuronal marker TUJ1, and nuclear stain DAPI. Scale bars 100 μm. (F) DAPI stained nuclei per well at 1 and 2 weeks showed increased number of nuclei in mir-4707 cell lines as compared to control lines. p-Values from a two-sided t-test on 30 technical replicates (wells) per condition. (G) The fraction of neurons (cells labeled with higher TUJ1 expression as compared to NESTIN expression while also being GFP positive, see Methods) showed fewer neurons in mir-4707 lines at week 1 but no differences at week 2. p-Values from a two-sided t-test on 30 technical replicates (wells) per condition. (H) Summary of the genetic associations between rs4981455 and expression of HAUS4, expression of miR-4707–3p, global cortical surface area, brain size, and educational attainment. The molecular mechanism by which miR-4707–3p influences downstream traits may be mediated through neural progenitor fate decisions, neuronal maturation, or synaptogenesis. However, the colocalization of genetic associations between the molecular traits and the brain phenotypes may also be a result of confounding, pleiotropy, or other mechanisms yet to be investigated.

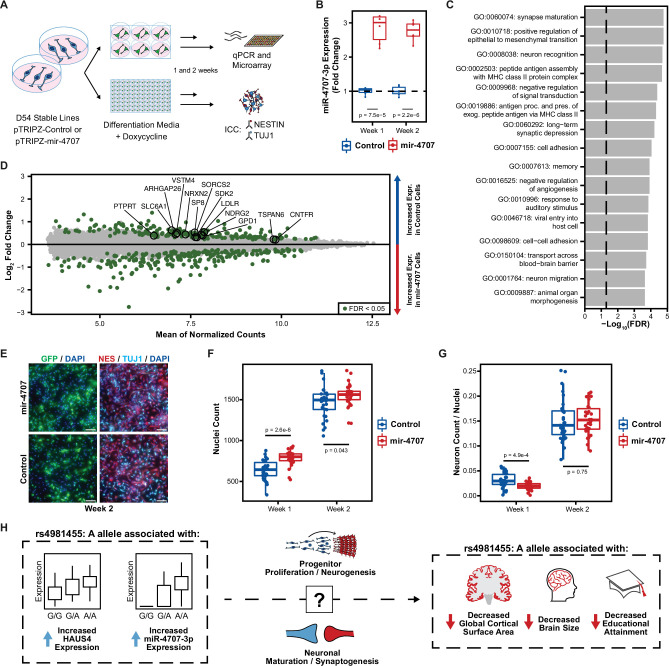
Figure 6.

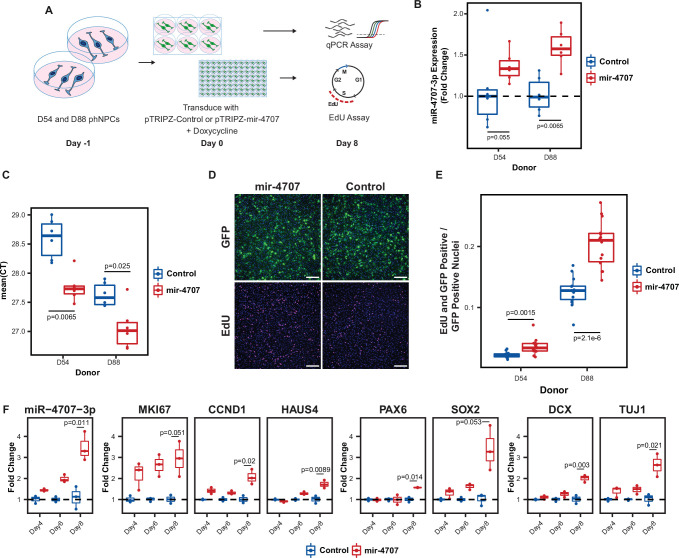
Figure 6—figure supplement 1. MiR-4707–3p overexpression in proliferating phNPCs.

Figure 6—figure supplement 1.

(A) Experiment overview. Primary human neural progenitor cells (phNPCs) from two donor lines (D54, genotype G/G at rs4981455, D88, genotype A/A at rs4981455) were maintained in proliferation media with growth factors that retain the phNPCs in a proliferative state and prevent differentiation into neurons. At day –1, cells were plated into 6-well and 96-well plates. The next day, day zero, cells are transduced with pTRIPZ-mir-4707-EGFP (pTRIPZ-mir-4707) or a control pTRIPZ-EGFP (pTRIPZ-Control). Addition of doxycycline in the proliferation media turns on mir-4707 and EGFP expression. Cells were assayed at eight days post transduction. (B) At 8 days post transduction, D54 and D88 transduced with pTRIPZ-mir-4707 showed an increase of miR-4707–3p expression over cells transduced with control virus. p-Values from a two-sided t-test on 6 samples per condition. (C) Mean qPCR cycle threshold (CT) values for D54 and D88 cells transduced with pTRIPZ-mir-4707 or control. D88 (genotype A/A at rs4981455) showed greater miR-4707–3p expression than D54 (genotype G/G at rs4981455). However, both lines expressed minimal amounts of miR-4707–3p despite tissue samples with G/G genotypes showing no expression of miR-4707–3p. p-Values from a two-sided t-test on 6 samples per condition. (D) GFP signal in both pTRIPZ-mir-4707 and pTRIPZ-Control at eight days post transduction. EdU pulse labeled nuclei also at 8 days post transduction. Nuclei in all four images are also stained with DAPI (blue signal). Scale bars 200 μm. (E) Proliferation assay using EdU pulse labeled cells. Both D54 and D88 cells transduced with pTRIPZ-mir-4707 showed an increased number of nuclei stained with both EdU and GFP. Each well was normalized for the total number of GFP-positive nuclei. p-values from a two-sided t-test on 14 technical replicates (wells) per condition. (F) Time course experiment using D88 cells transduced with pTRIPZ-mir-4707 or control virus as in A, but assayed at 4, 6, and 8 days post transduction. Gene expression measured with qPCR shows increased miR-4707–3p in cells transduced with pTRIPZ-mir-4707 over pTRIPZ-Control. Increased expression is also seen in the proliferation markers (MKI67, CCND1, and HAUS4), the progenitor markers (PAX6 and SOX2), and the neuronal markers (DCX and TUJ1). p-Values from a two-sided t-test on fold changes between samples transduced with pTRIPZ-mir-4707 and pTRIPZ-Control at 8 days post transduction for three samples in each condition.
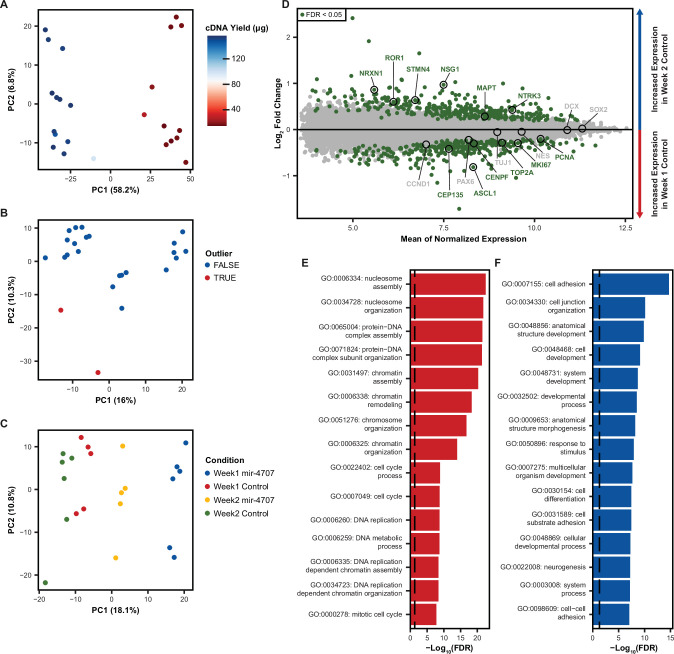
Figure 6—figure supplement 2. Microarray expression in differentiating phNPCs.

Figure 6—figure supplement 2.

(A) Principal component analysis (PCA) on uncorrected mRNA expression as measured by microarray on mir-4707 and control cell lines at 1 and 2 weeks post plating in differentiation media. The primary source of variation (PC1) is associated with a technical variable, cDNA yield measured during sample preparation. (B) After correcting global mRNA expression for cDNA yield using a linear model, PCA revealed two sample outliers that were removed before proceeding with differential expression analysis. (C) PCA after outlier removal and correcting for cDNA yield showed samples primarily segregating by expression of mir-4707 and time point. (D) Differential mRNA expression analysis between week 1 and week 2 control samples showed an increase in neuron associated genes in week 2 samples and an increase in progenitor associated genes in week 1 samples. (E) Gene ontology analysis on differentially expressed genes upregulated in week 1 control cells as compared to week 2 control cells. Enrichment p-values corrected by FDR. Dotted line represents an FDR corrected p-value of 0.05. (F) Gene ontology analysis on differentially expressed genes upregulated in week 2 control cells as compared to week 1 control cells. Enrichment p-values corrected by FDR. Dotted line represents an FDR corrected p-value of 0.05.