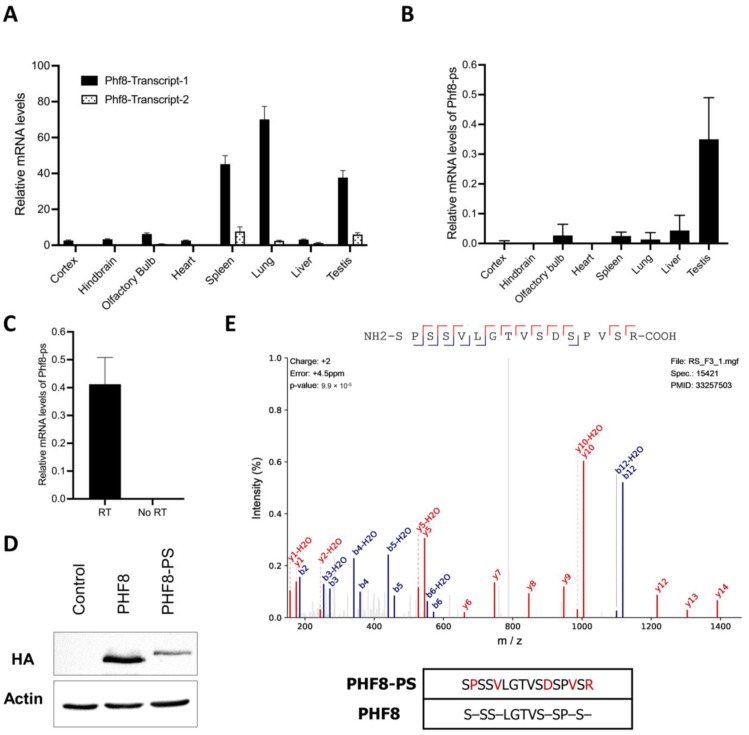
Figure 2.
Phf8-ps mRNA and protein expression. (A,B) Relative mRNA levels of (A) Phf8 transcripts 1 and 2 and (B) Phf8-ps transcript were measured in different mouse organs or tissues by quantitative PCR and normalized to that of GAPDH (n=3 per organ/tissue). (C) Relative mRNA levels of Phf8-ps transcript were measured by quantitative PCR using on cDNA from testis samples prepared with or without reverse transcriptase. Levels were normalized to mRNA levels of GAPDH (n = 3 per condition). (D) NIH3T3 cells were transfected to transiently overexpress HA/FLAG-tagged PHF8 and PHF8-PS. Protein levels of PHF8 and PHF8-PS were analyzed by Western blotting as indicated. (E) Peptide spectrum of a unique PHF8-PS peptide (SPSSVLGTVSDSPVSR). This unique peptide was found in the dataset of mouse germ cell proteome [40]. The sequence homology between this PHF8-PS peptide and PHF8 protein is represented at the bottom panel.

