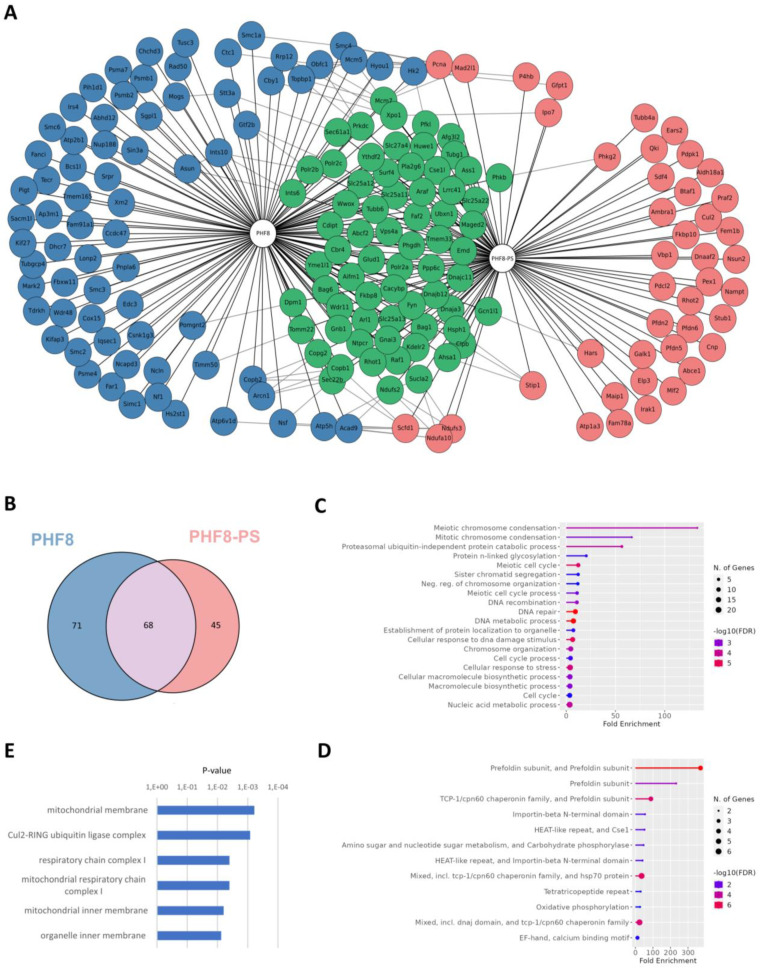
Figure 5.
Identification of PHF8-PS-interacting proteins. (A) Schematic representation of PHF8- and PHF8-PS-interacting network. PHF8 and PHF8-PS complexes were purified in HEK293 cells transiently expressing these proteins. Protein interactions retrieved from the STRING database were indicated. (B) Venn diagram showing the overlap between PHF8- and PHF8-PS-interacting proteins. (C,D) Gene Ontology (GO) analysis of (C) PHF8-specific and (D) PHF8-PS-specific interacting proteins using the ShinyGO tool (version 0.76.1). (E) Gene Set enrichment analysis (GSEA) of PHF8-PS-specific interacting proteins with the cellular component ontology. Cellular components are sorted by p-value ranking.

