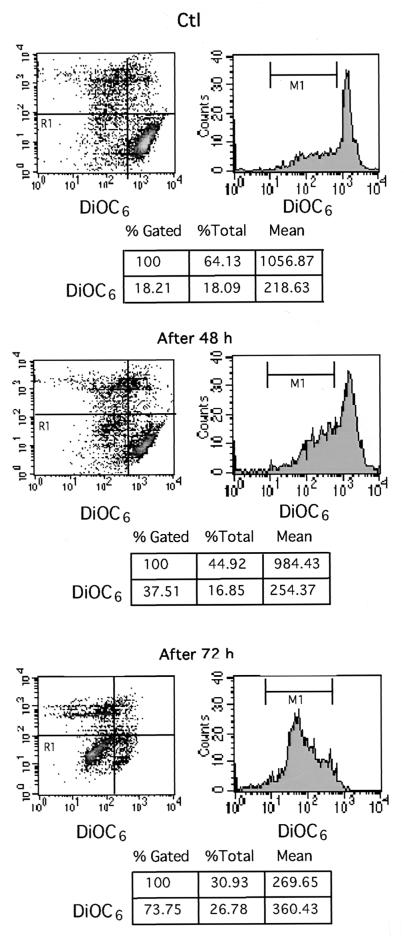
FIG. 3.
DiOC6 staining and flow cytometric analysis of T84 cell apoptosis after 48 and 72 h of coculture with H. pylori strains. The conditions of coculture were the same as for the experiment in Fig. 2. Control (Ctl) cells or T84 cells infected for 48 h (After 48 h) or 72 h (After 72 h) were incubated with DiOC6 (40 nM) before being subjected to analysis by flow cytometry by a method described in Materials and Methods. The area at the low left (R1) indicates apoptotic cells with a drop in mitochondrial potential, and the percentage of apoptotic cells is given in the charts below the diagrams. Data are from a representative experiment (n = 3).

