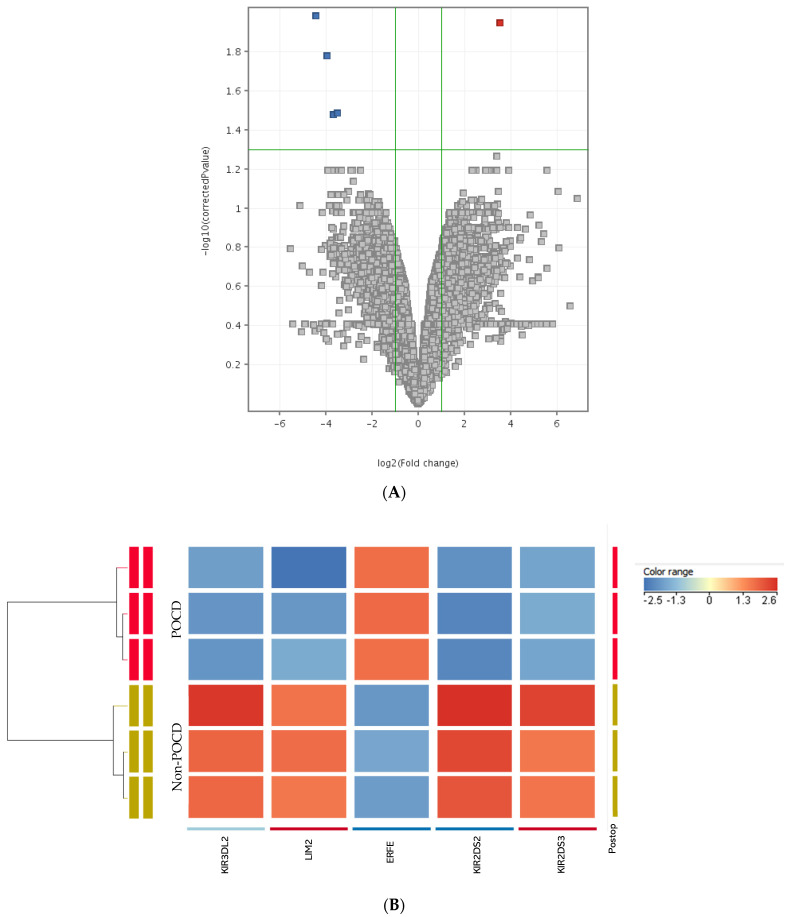
Figure 3.
Distribution of differentially expressed genes. (A) Volcano plot showing upregulated (red) genes on the top right and downregulated (blue) genes on the top left of the plot. Genes in grey color are not significantly expressed. (B) Heatmap showing the upregulated (red) and downregulated (blue) genes in POCD and non−POCD condition.

