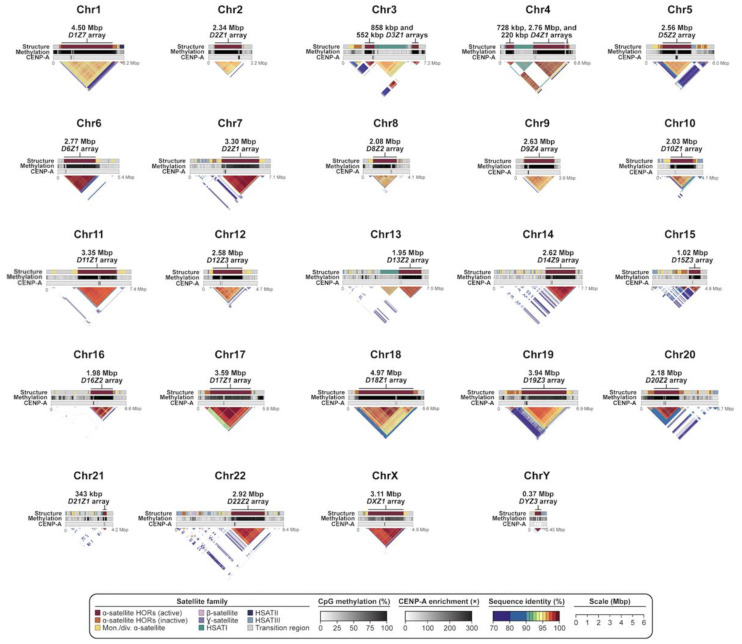
Figure 2.
Sequence composition, DNA methylation pattern, and CENP-A chromatin organization of each centromere in the T2T-CHM13 genome. Tracks showing the sequence composition, frequency of methylated CpG dinucleotides, and fold-enrichment of CENP-A ChIP-seq reads over bulk nucleosomal reads (or in the case of chromosome Y, the number of CENP-A CUT and RUN reads) for each centromere in the T2T-CHM13 v2.0 genome. Triangular StainedGlass [56] plots indicate the pairwise sequence identity between 5 kbp segments along each centromeric region and are colored by sequence identity. Warmer colors indicate higher sequence identity, and colder colors indicate lower sequence identity (as indicated in the legend).

