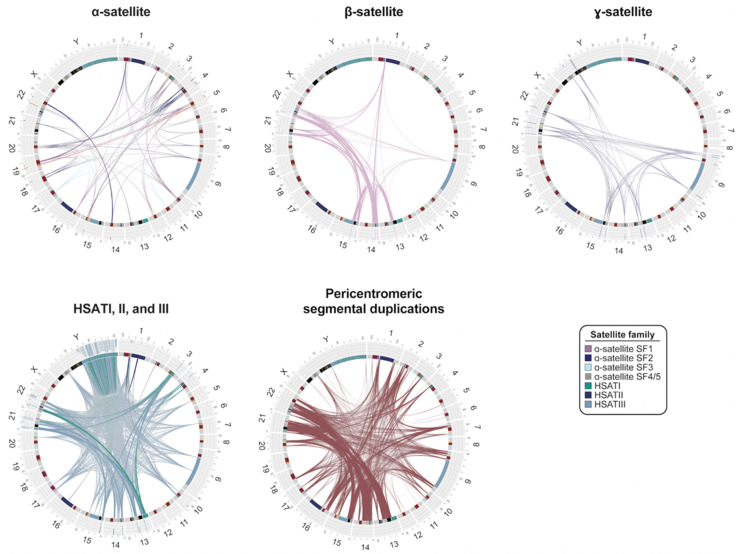
Figure 3.
Interchromosomal relationships between centromeric satellite DNA and pericentromeric segmental duplications. Circos plots showing sequence relationships among four different satellite families as well as pericentromeric segmental duplications in the T2T-CHM13 genome. Connecting line widths for satellite families indicate the proportion of 75-mers shared between arrays (i.e., thicker lines indicate greater overall sequence similarity between different arrays of the same family). α-satellite lines are colored by their suprachromosomal family (SF) assignment. Radial bar plots indicate specificity of 75-mers proportionally, with white indicating 75-mers unique to the array, light gray indicating 75-mers shared with other centromeric regions, and black indicating 75-mers shared with regions outside of centromeres. The pericentromeric segmental duplication circos plot shows pairwise alignments between pericentromeric regions that are >1 kbp and >90% identical.

