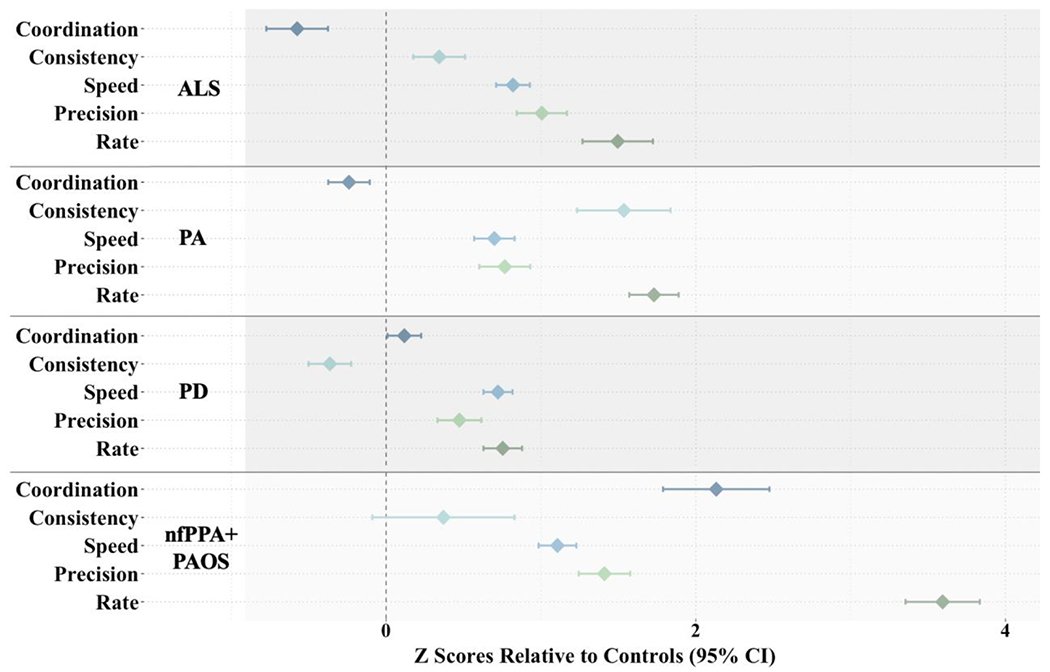
Figure 4.

Forest plot demonstrating divergent patterns of articulatory performance across the four clinical groups. Each diamond represents the mean z score (clinical group compared to controls) with the 95% confidence interval (CI) for each articulatory component. Z scores to the right of the vertical dotted line (i.e., positive z scores) indicate that the clinical group is more impaired than controls.
