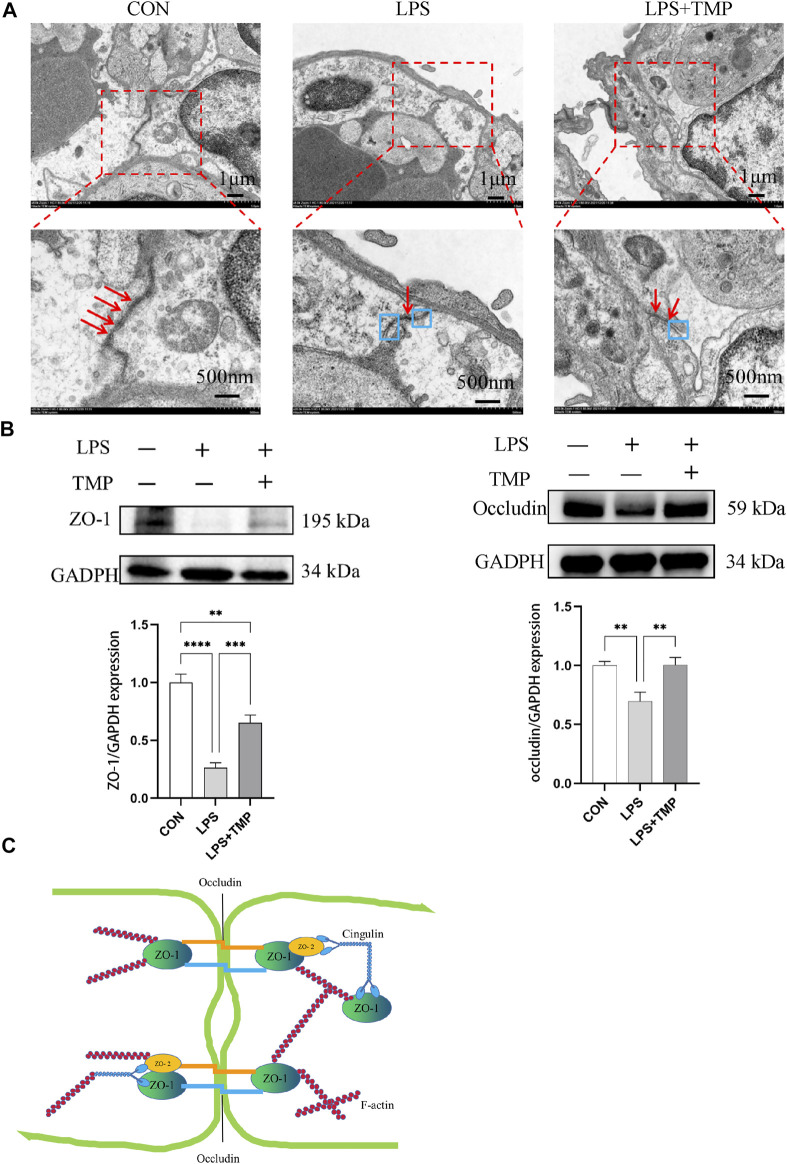
FIGURE 7.
Impact of TMP on tight junction connections. (A) TEM observation of tight junction connections (red arrows represent tight connections, blue boxes represent separation of tight junction connections). (B) ZO-1 and Occludin protein levels were evaluated by Western blotting. (C) F-actin activation decreased ZO-1 and Occludin. ** p < 0.01, *** p < 0.001, **** p < 0.00001, n = 3 per group.

