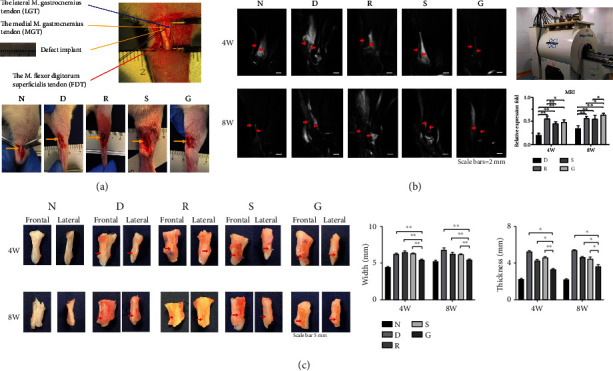
Figure 1.

The Achilles tendon defect model and macroscopic repair assessment. (a) Schematic diagram of the anatomy of the rat Achilles tendon and comparison of postoperative surgical areas in different repair groups. Group N: normal tendon (control group); Group D: defect suture group; Group R: allogeneic replacement repair group; Group S: smooth SF film repair group; Group G: micropattern SF film repair group. (b) MRI comparison of tendon repair after 4 and 8 weeks. The red arrow indicates the repaired area, and the repair signal intensity in group G was significantly higher than that in other groups at 8 weeks. (c) Comparison of the width and thickness of the Achilles tendon repair samples. The width and thickness of Group G were significantly lower than those of the other repair groups.
