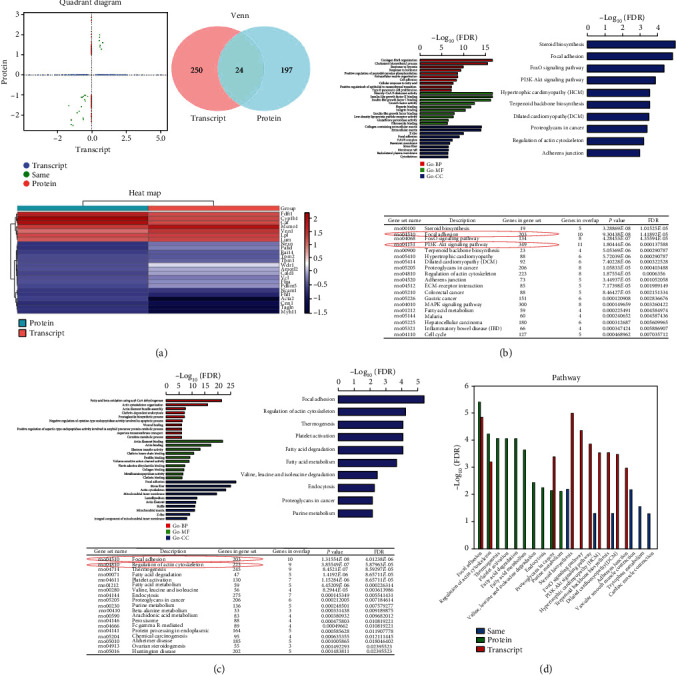
Figure 4.

Results of bioinformatics analysis. (a) The quadrant diagram, Venn diagram (Venn), and heatmap of combined analysis of transcriptomics and proteomics. (b) The transcriptome sequencing results, including GO and KEGG enrichment analyses. (c) The proteomic results, including GO and KEGG enrichment analyses. (d) Signaling pathway enrichment analysis of combined transcriptomic and proteomic sequencing results.
